- The Power BI connector lets you easily load your model from Speckle into Power BI in a tabular format.
- The 3D Viewer Visual allows you to view and color your models in 3d.
Setup
Install the connector
Open the Power BI connector
- Select Get Data. 2. In the search box, enter Speckle. 3. Select Connect to Speckle and click Connect.
Why don't I see Speckle as a data source in Power BI?
Why don't I see Speckle as a data source in Power BI?
Loading a Model
Load from Speckle
- Copy Model URL from the web app.
- Paste it in the text field and select OK.
Import 3D Visual
- In the Visualizations pane, select the three dots (…), then select Import a visual from a file.
- Browse to
Documents/Power BI Desktop/Custom Visuals. - Select
Speckle 3D Visual.pbivizand Open.
Visualize a model
- In the Visualizations pane, select Speckle 3D Visual
- Configure the visual:
- Drag Version Object ID column into the Version Object ID input -> required for viewing
- Drag Object IDs column into the Object IDs input -> required for interactivity
- Drag any column into Tooltip input -> for tooltip
- Drag any column into Color by input -> for coloring model
- Wait for your model to load in the viewer
Where do I find the 3D visual?
Where do I find the 3D visual?
Where's the Model URL in the new Power BI connector?
Where's the Model URL in the new Power BI connector?
Why do I get an 'Access to the resource is forbidden' error?
Why do I get an 'Access to the resource is forbidden' error?
- Go to File > Options and settings > Options > Security
- Under Authentication Browser, clear Use my default web browser
Why do I get a 'Permission denied' error?
Why do I get a 'Permission denied' error?
Why do I get an 'Unable to connect remote server' error?
Why do I get an 'Unable to connect remote server' error?
Can I load and visualize private projects with the Power BI connector?
Can I load and visualize private projects with the Power BI connector?
Why doesn't my report update after a new version is published?
Why doesn't my report update after a new version is published?
- Refresh preview Make sure you clicked Refresh in the Power BI ribbon to load the latest version.
- Check if you loaded a specific version If your model URL contains an ”@” symbol, this means you loaded a specific version. Power BI connector will only load that specific version and not any new versions.
How do I visualize multiple models in Power BI?
How do I visualize multiple models in Power BI?
- First, federate your models in the web app.
- Copy the federated model URL
- Load federated model in Power BI.
How do I control the visibility of unselected elements in the 3D visual?
How do I control the visibility of unselected elements in the 3D visual?
How do I hide the Speckle logo from the 3D visual?
How do I hide the Speckle logo from the 3D visual?
Why can I view a model in Speckle but can't load it in Power BI?
Why can I view a model in Speckle but can't load it in Power BI?
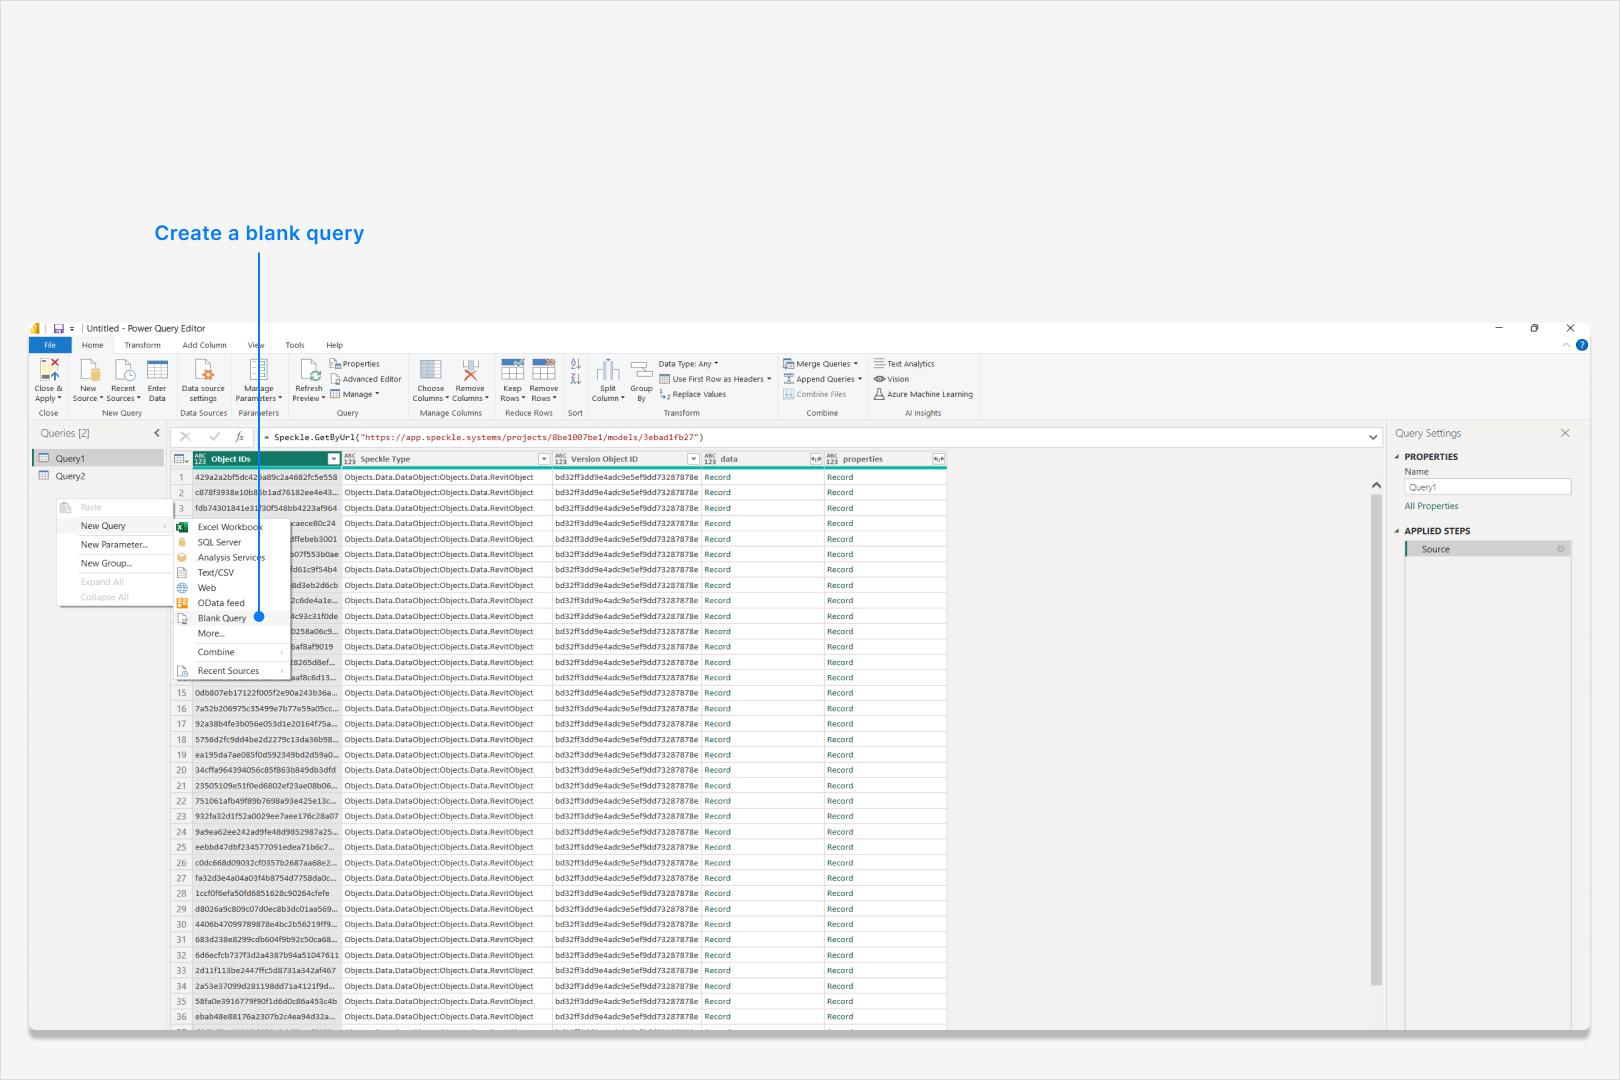
Helper Functions
We’ve added a series of helper functions to theSpeckle namespace to make working with Speckle data in Power BI more efficient and user-friendly.
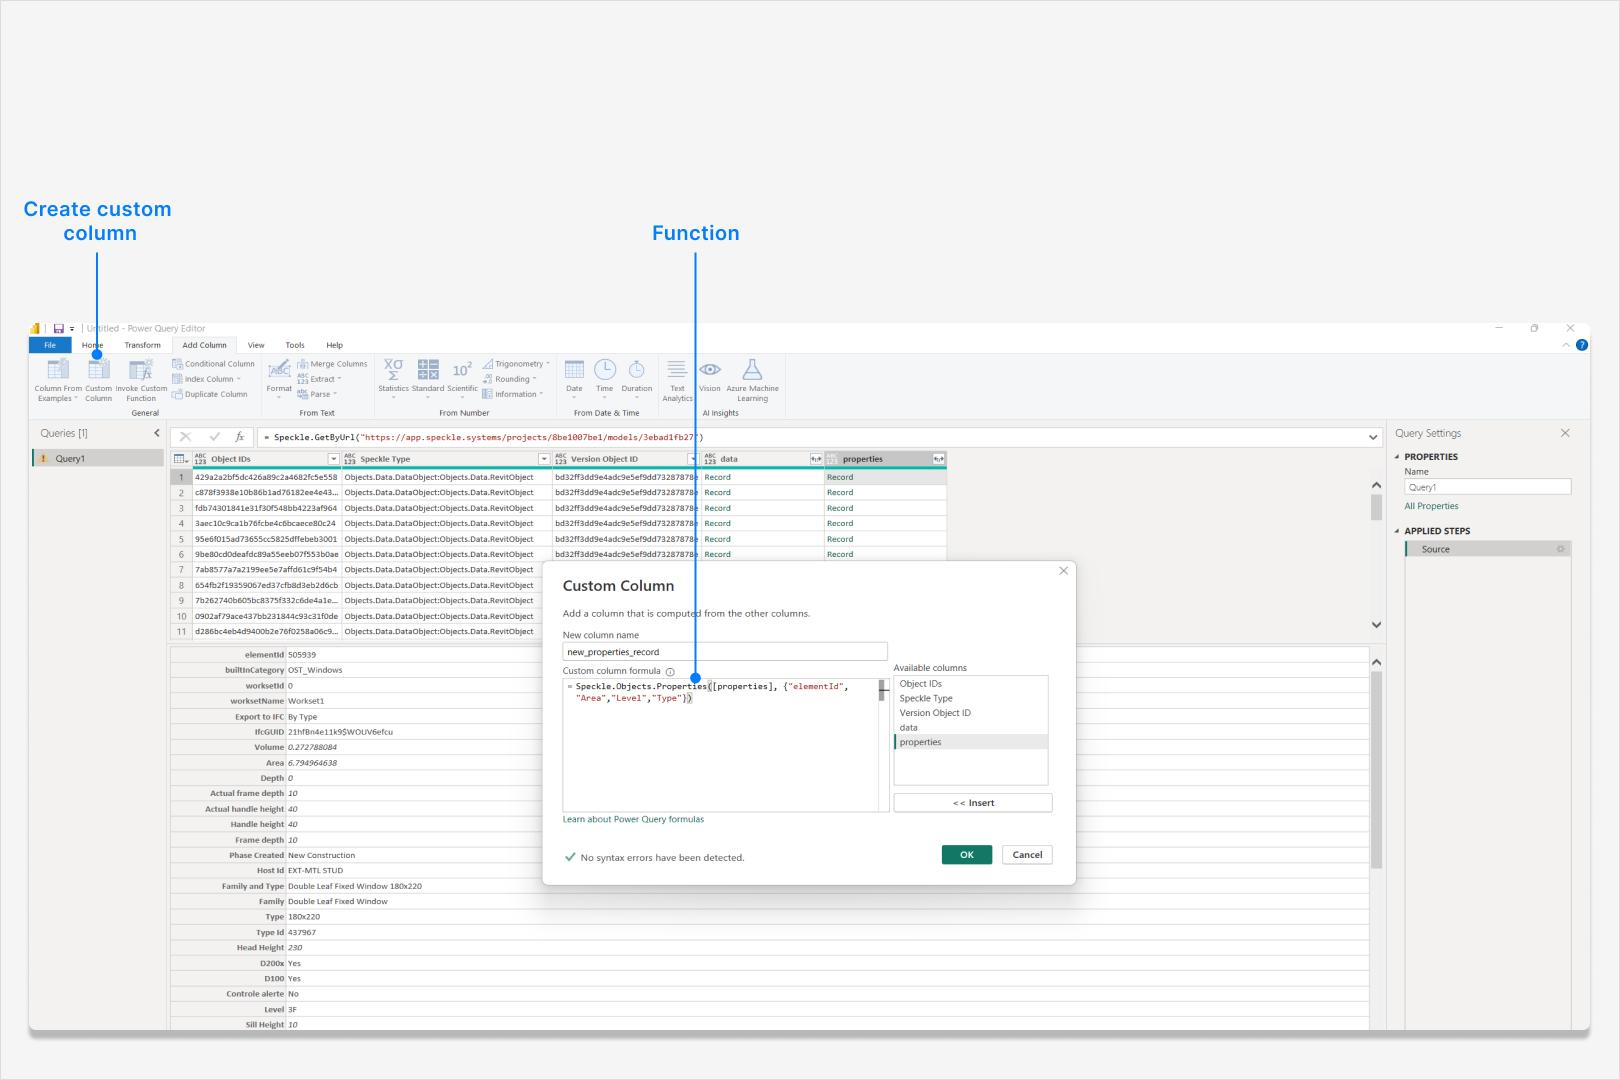
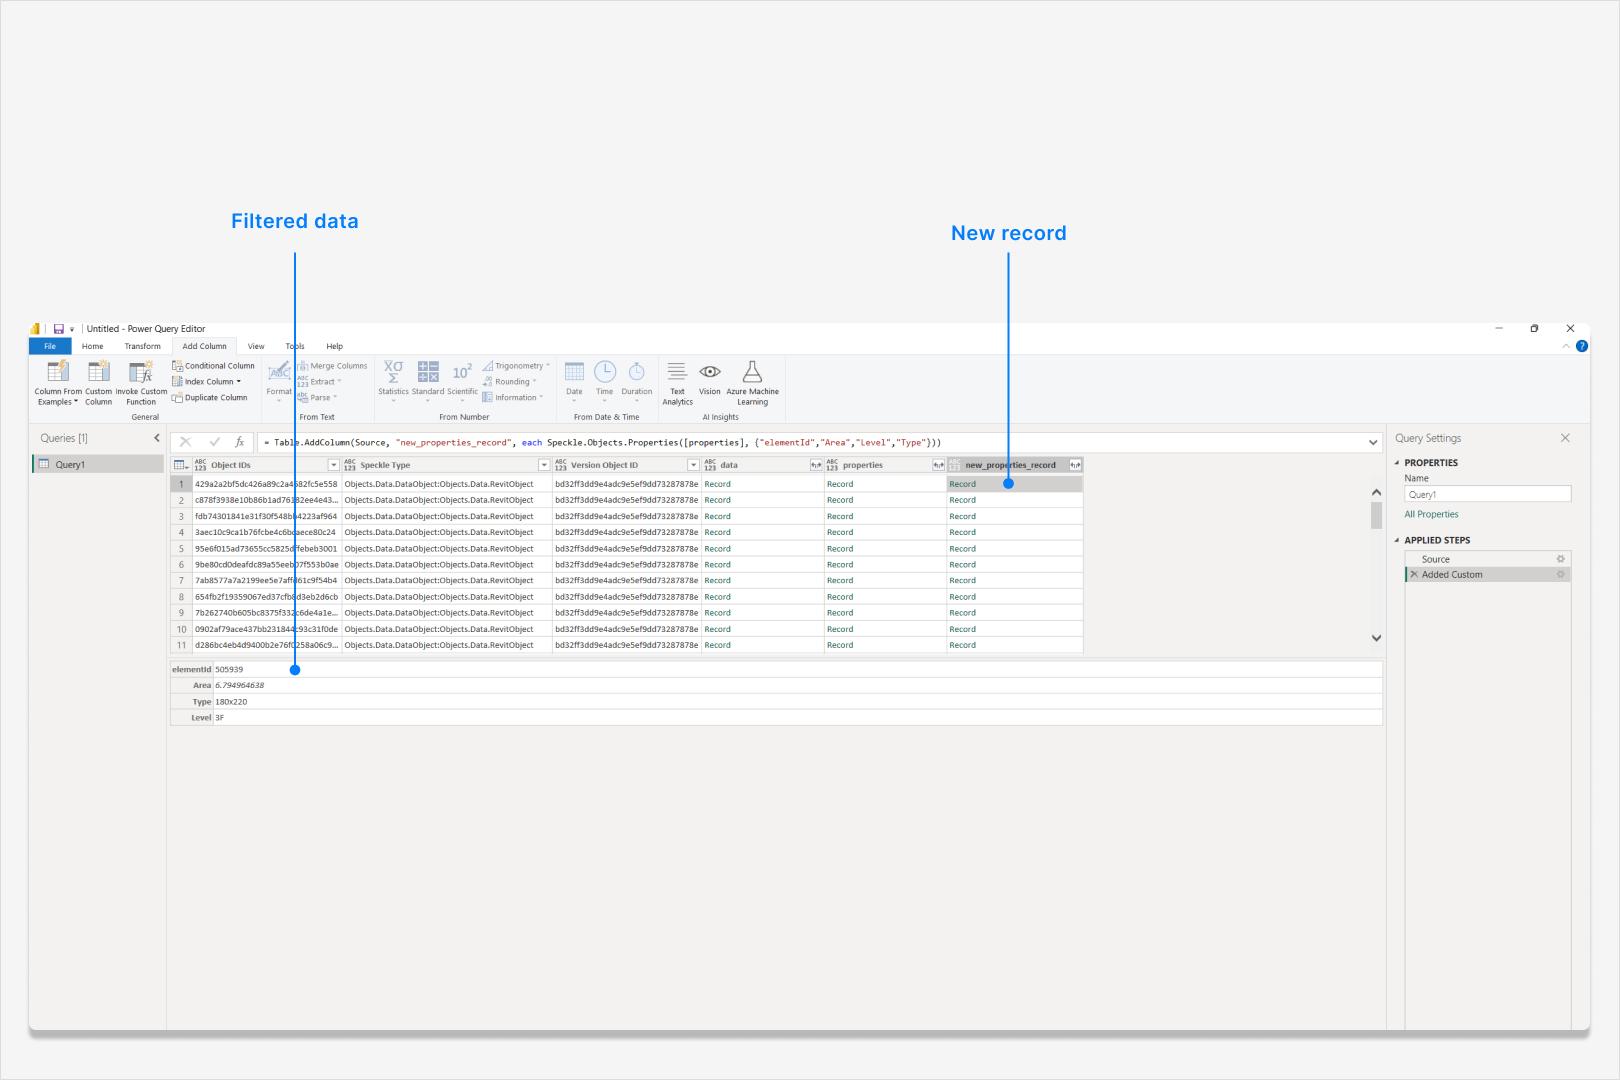
Speckle.Objects.PropertiesWorking with properties can be tricky—they’re often deeply nested and inconsistently structured. This helper function simplifies the process.
Returns a record containing properties and their values from the given
inputRecord. Optionally, you can provide filterKeys to extract only specific properties.
Show Example
Show Example

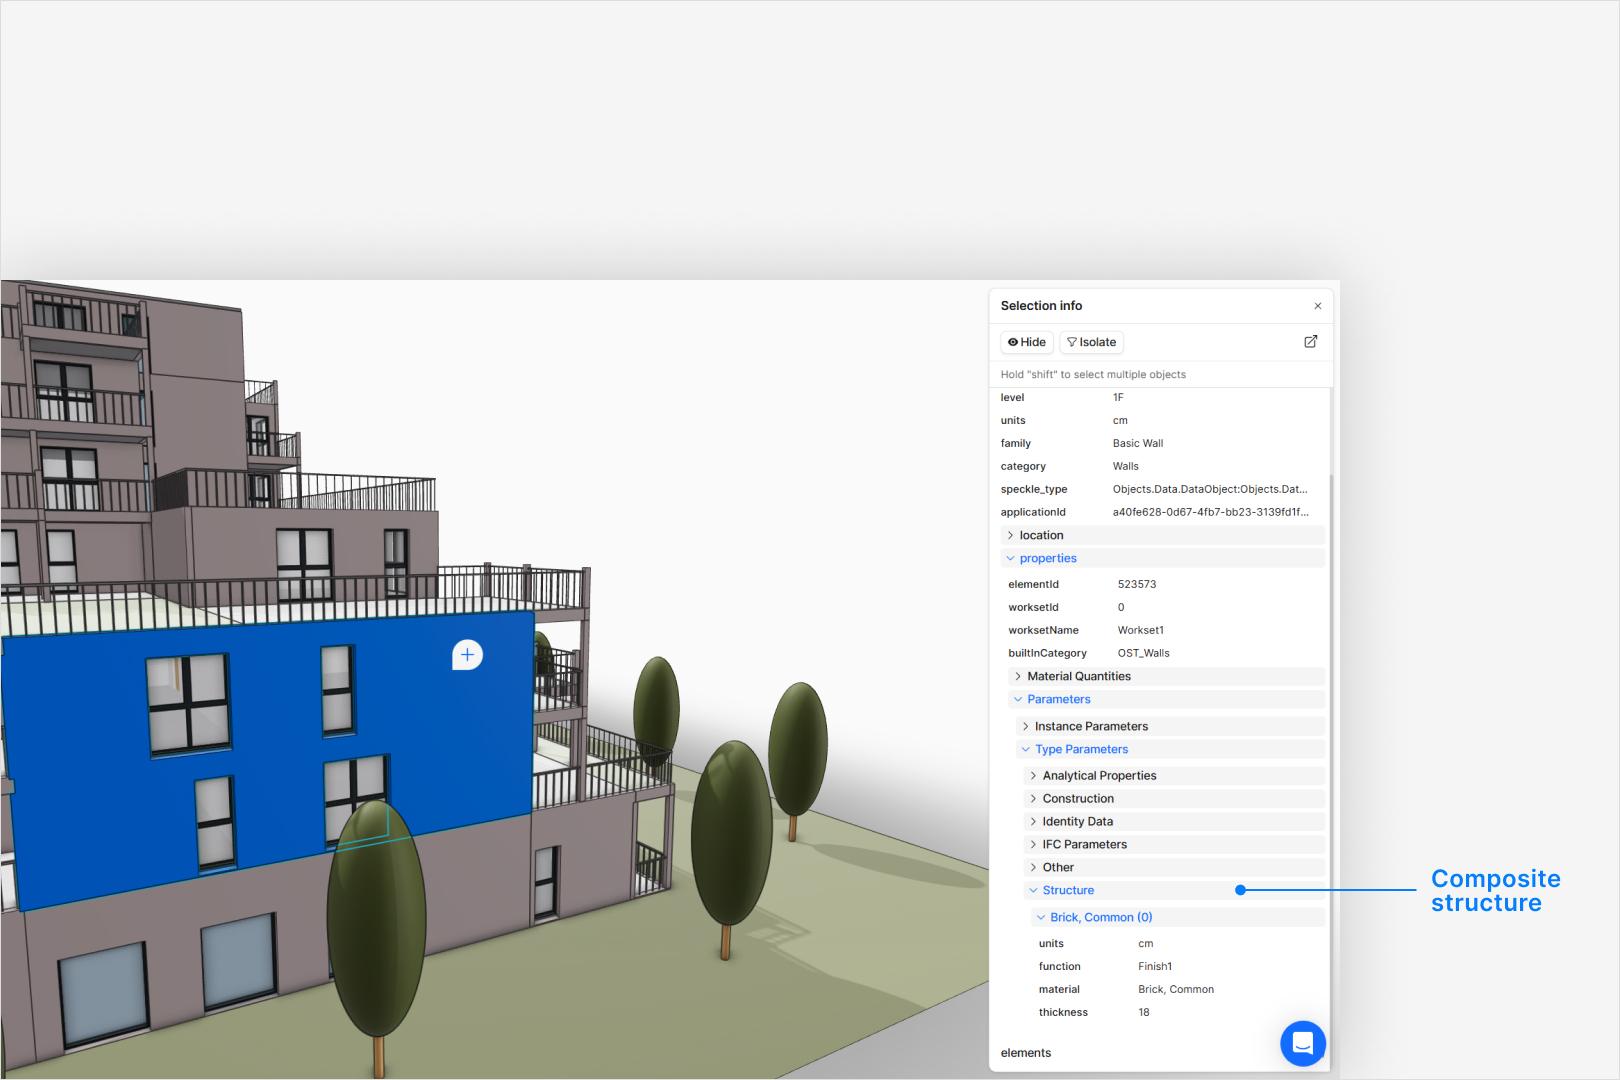
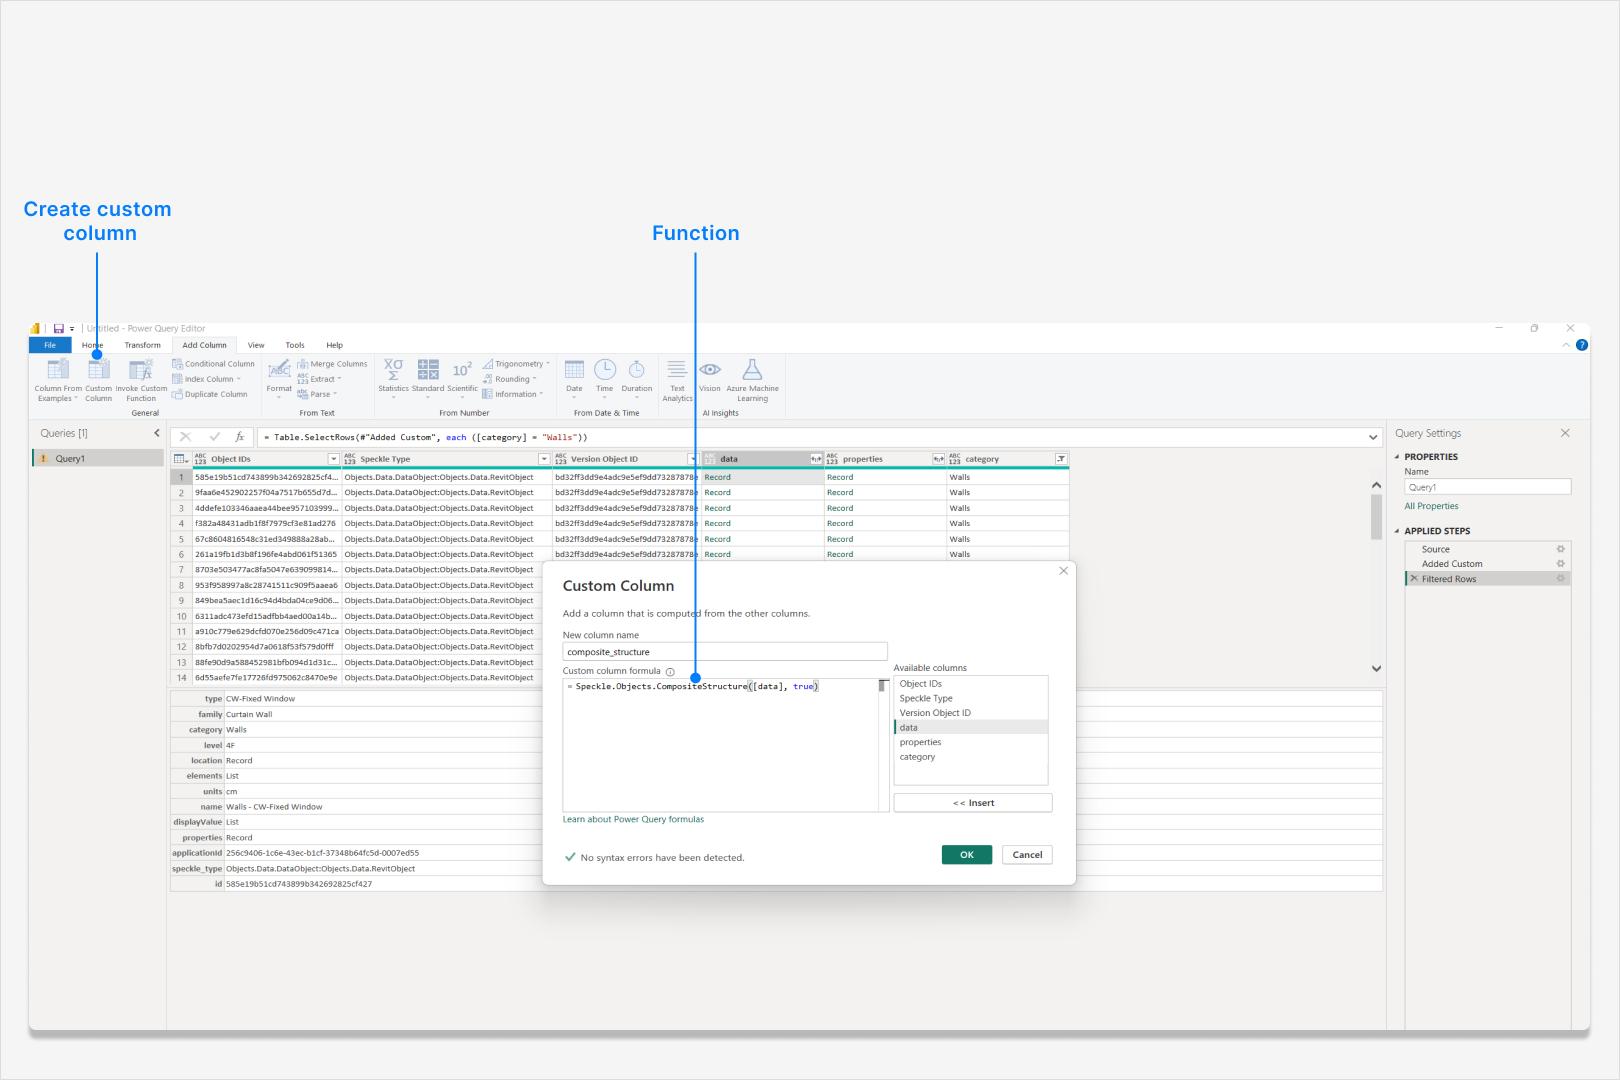
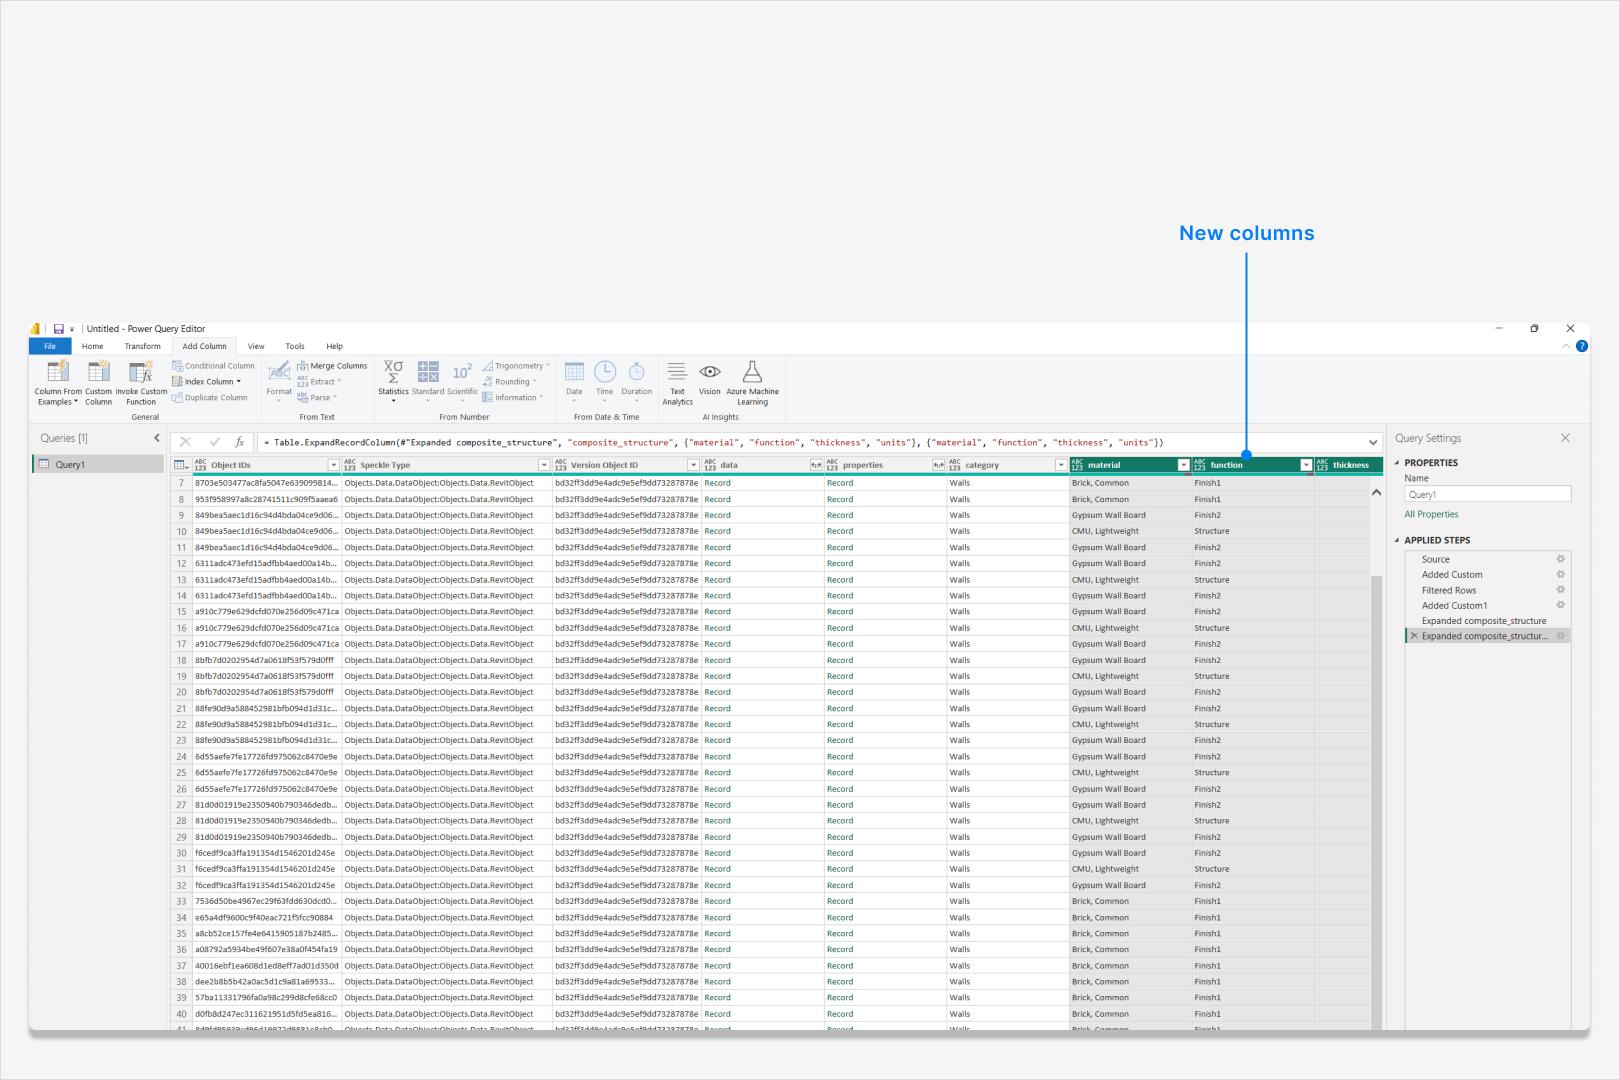
Speckle.Objects.CompositeStructure
Use this function to extract the composite structure of an object, such as a Wall, Floor, or Roof. This is especially useful for understanding layered compositions in your models.
Note: Currently only supported for Revit and Archicad models.
Takes an object record as input and returns its composite structure.
- By default, returns a record.
- Set
outputAsListtotrueto return the composite structure as a list—useful for expanding each layer into its own row.
Show Example
Show Example
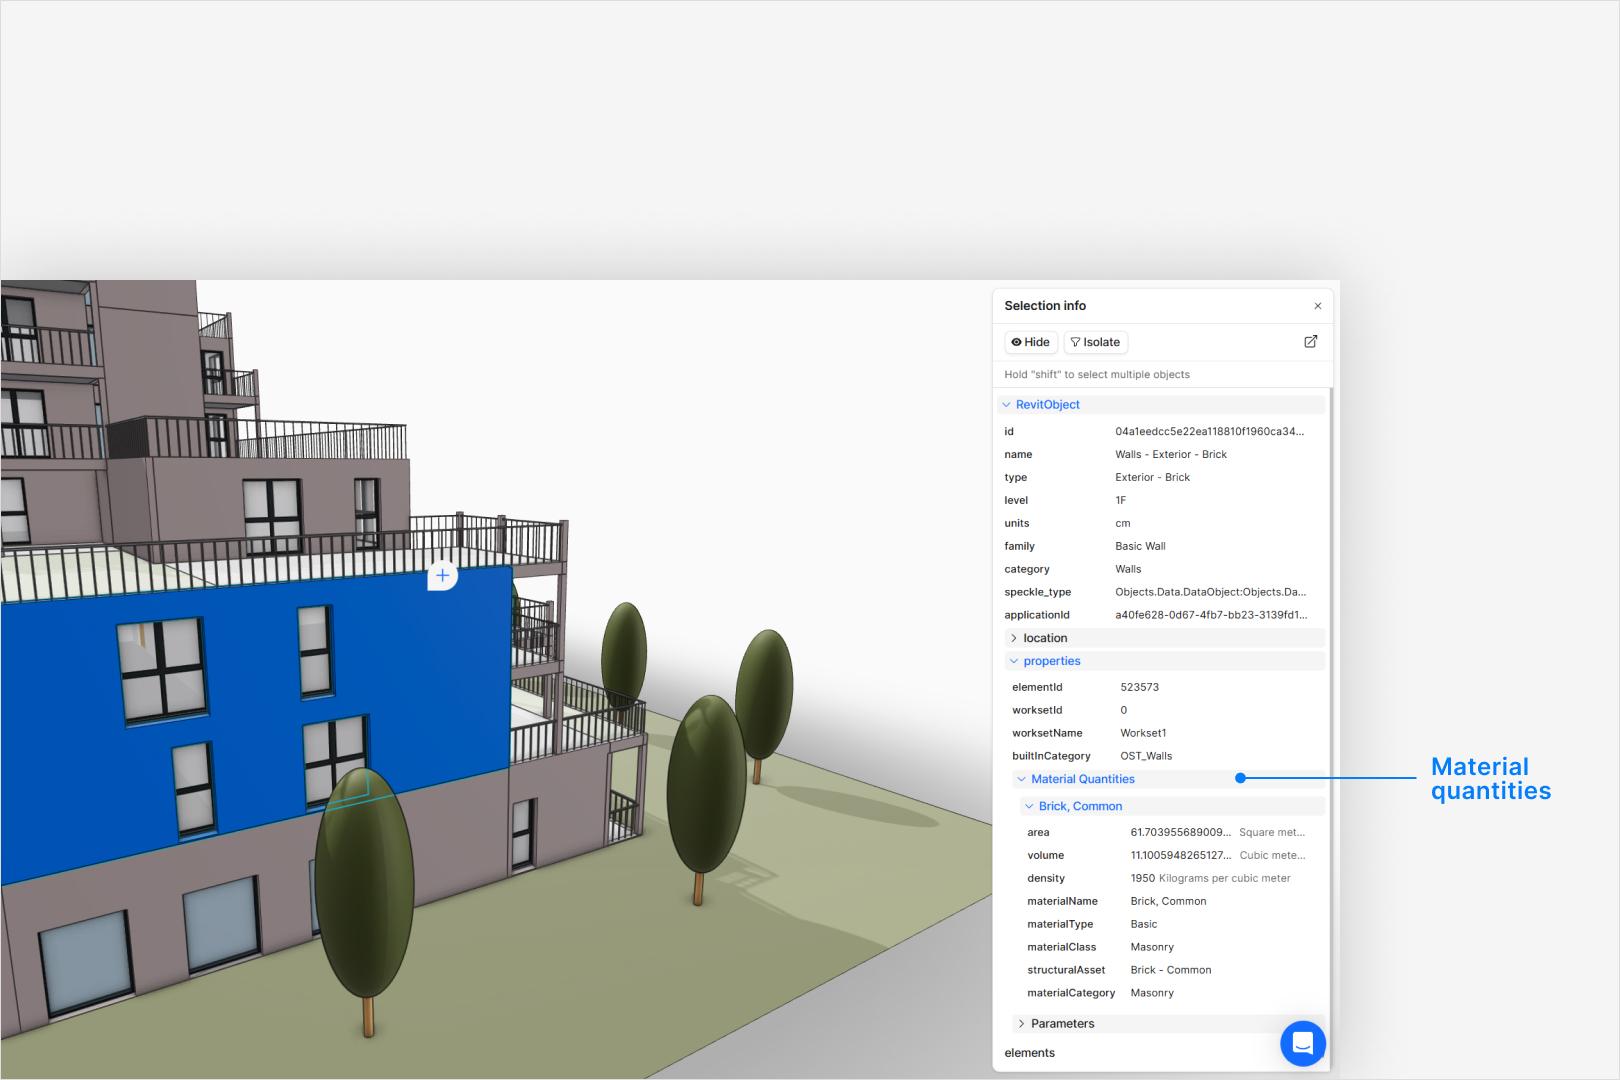
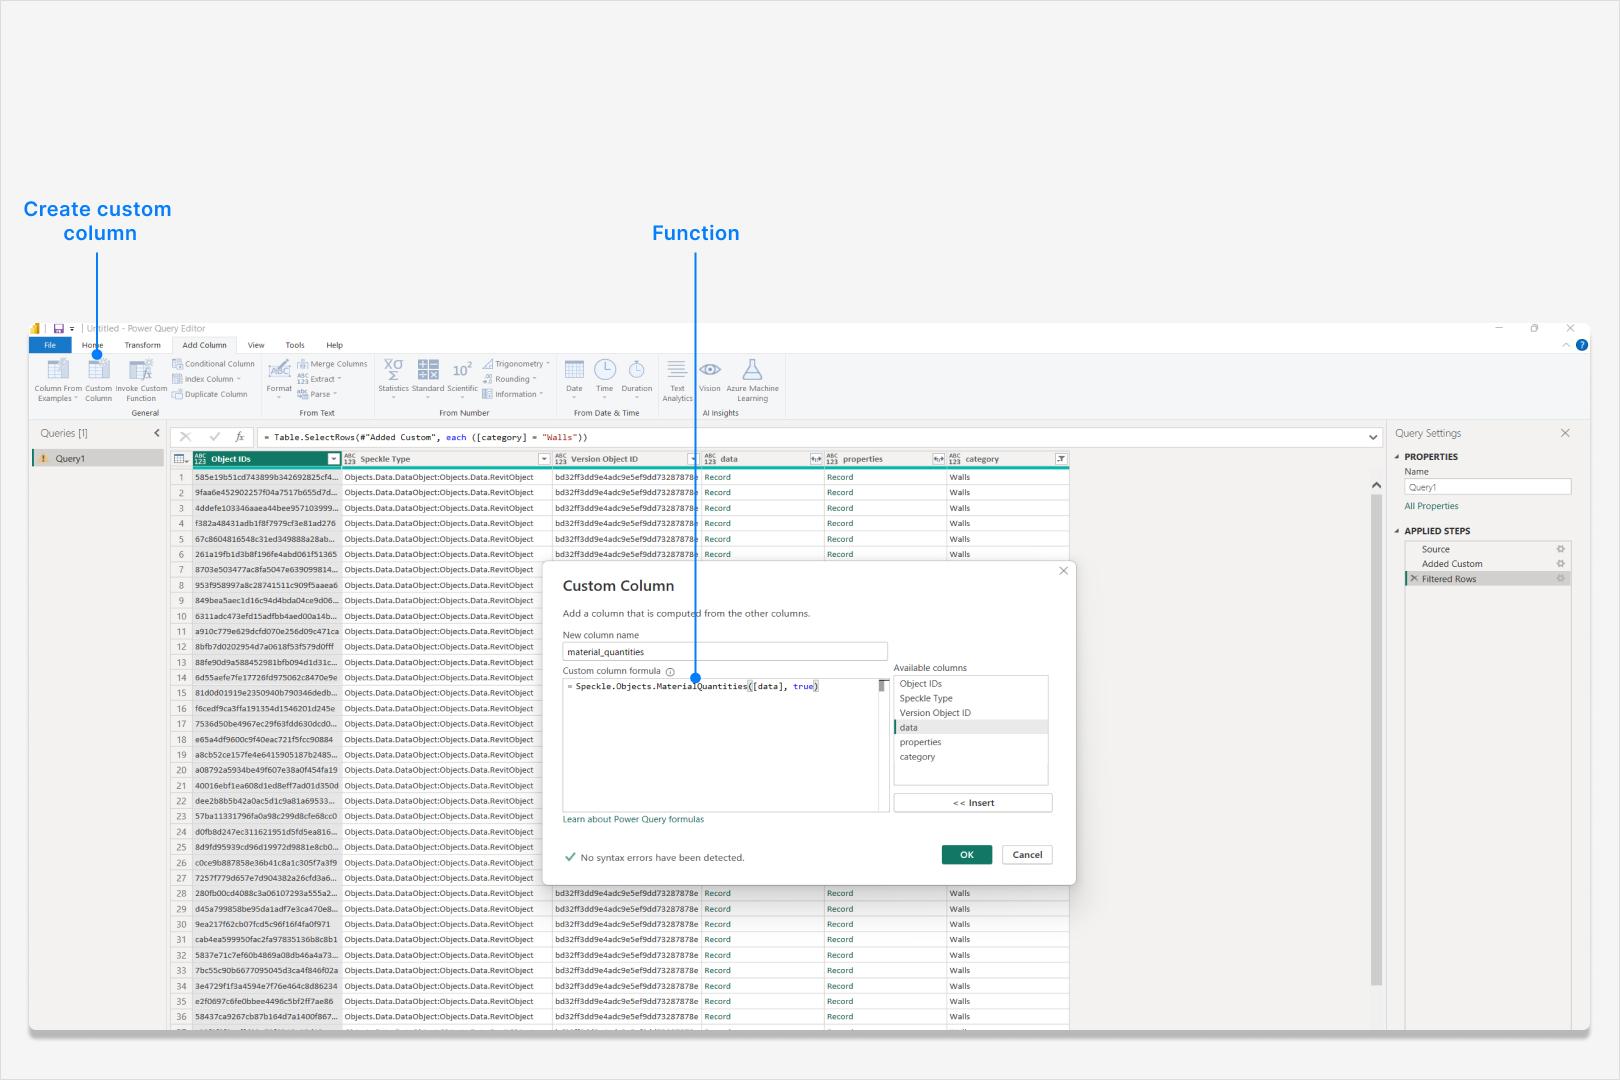
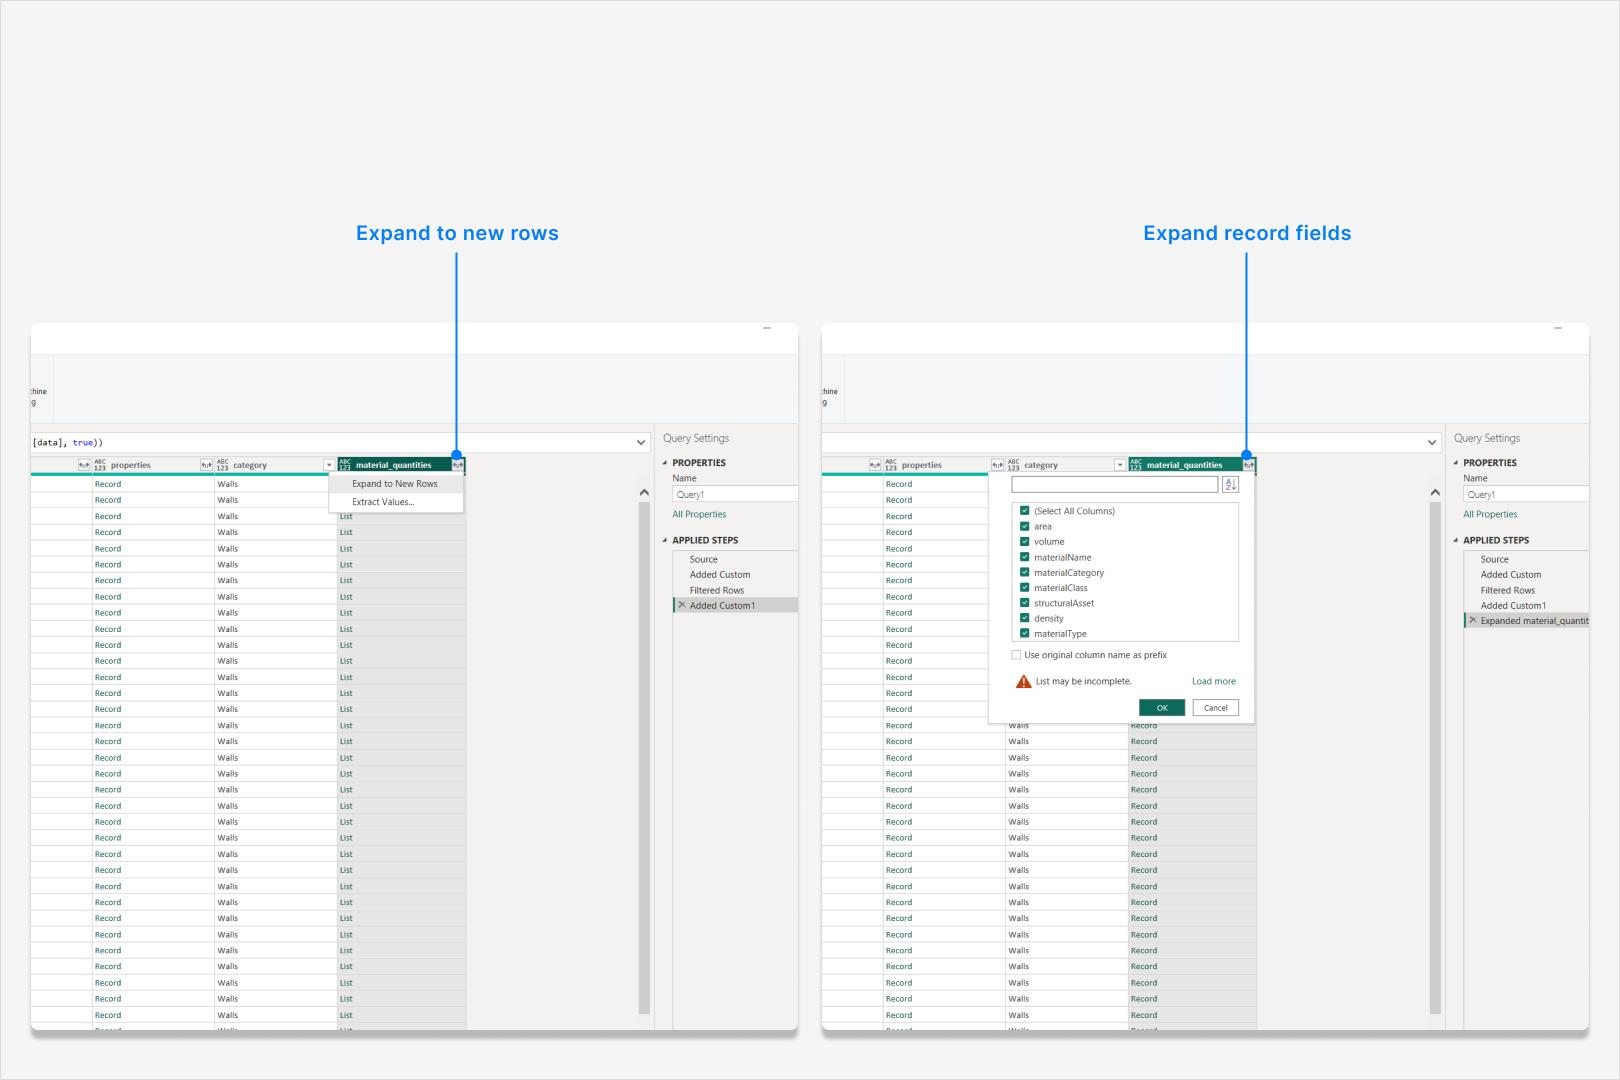
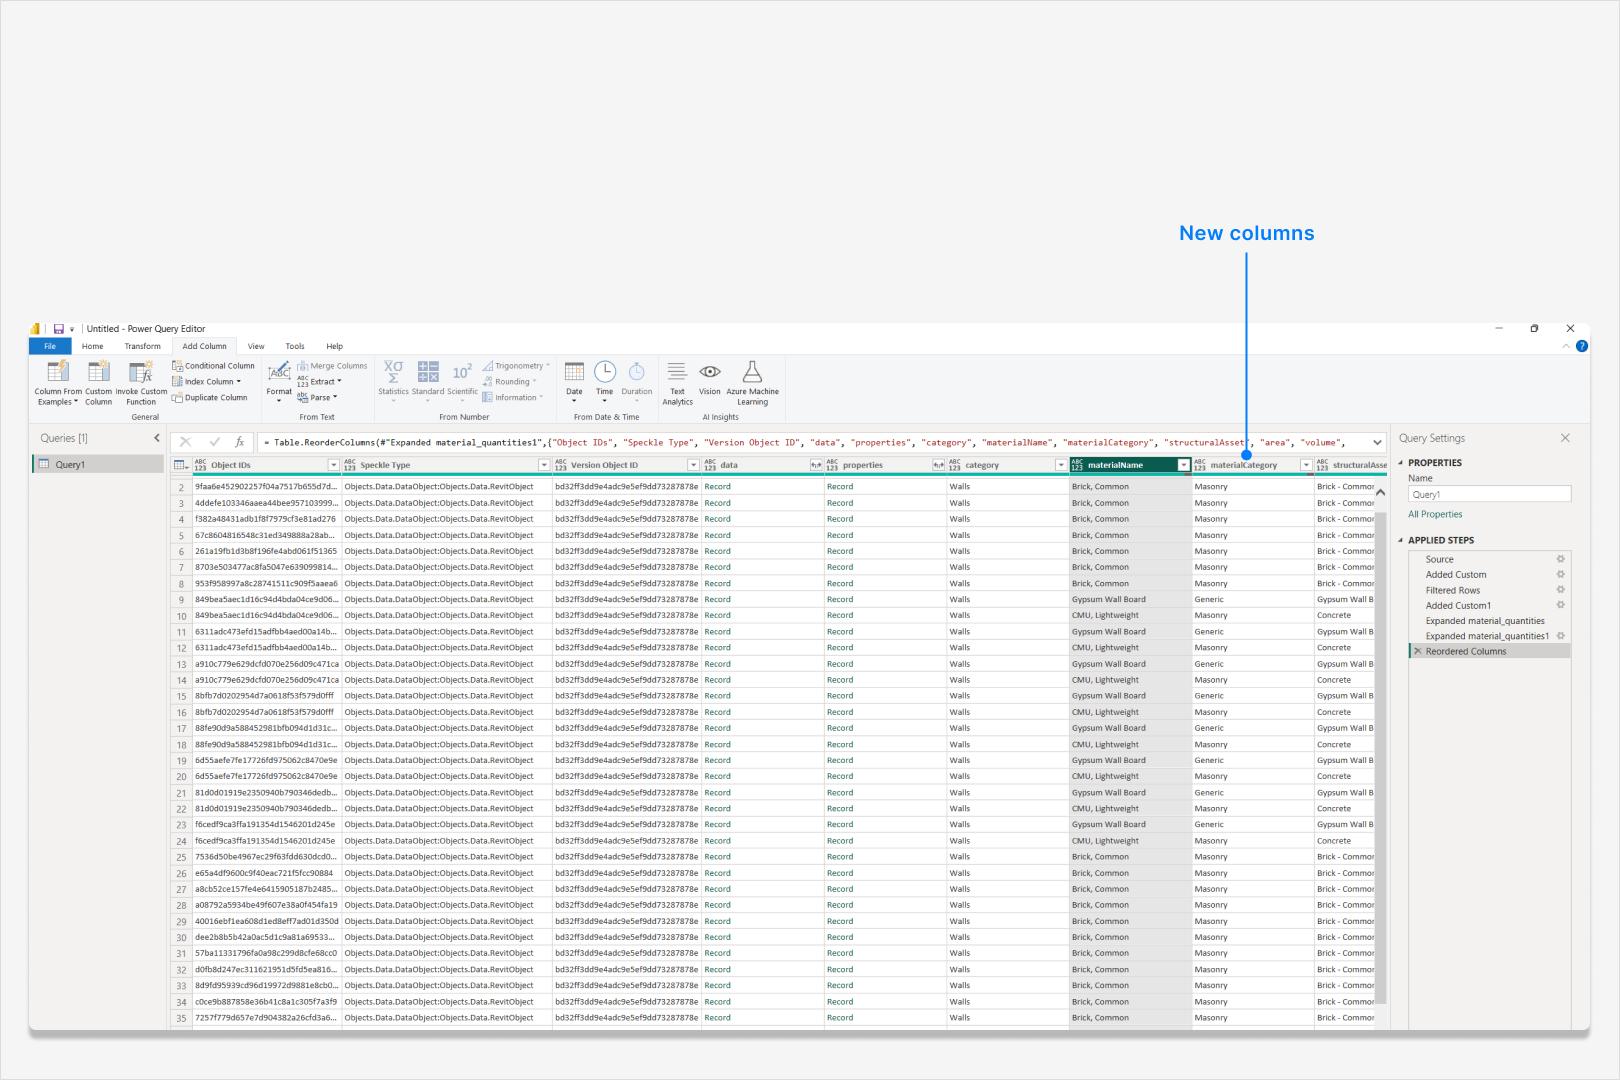
Speckle.Objects.MaterialQuantities
Quickly access material quantities of an object—ideal for use in Power BI’s “Add Column” transformation flow, as it operates on individual records.
Takes an object record and returns a record containing its material quantities.
- Set
outputAsListtotrueto return quantities as a list, which is helpful for row expansion.
Show Example
Show Example
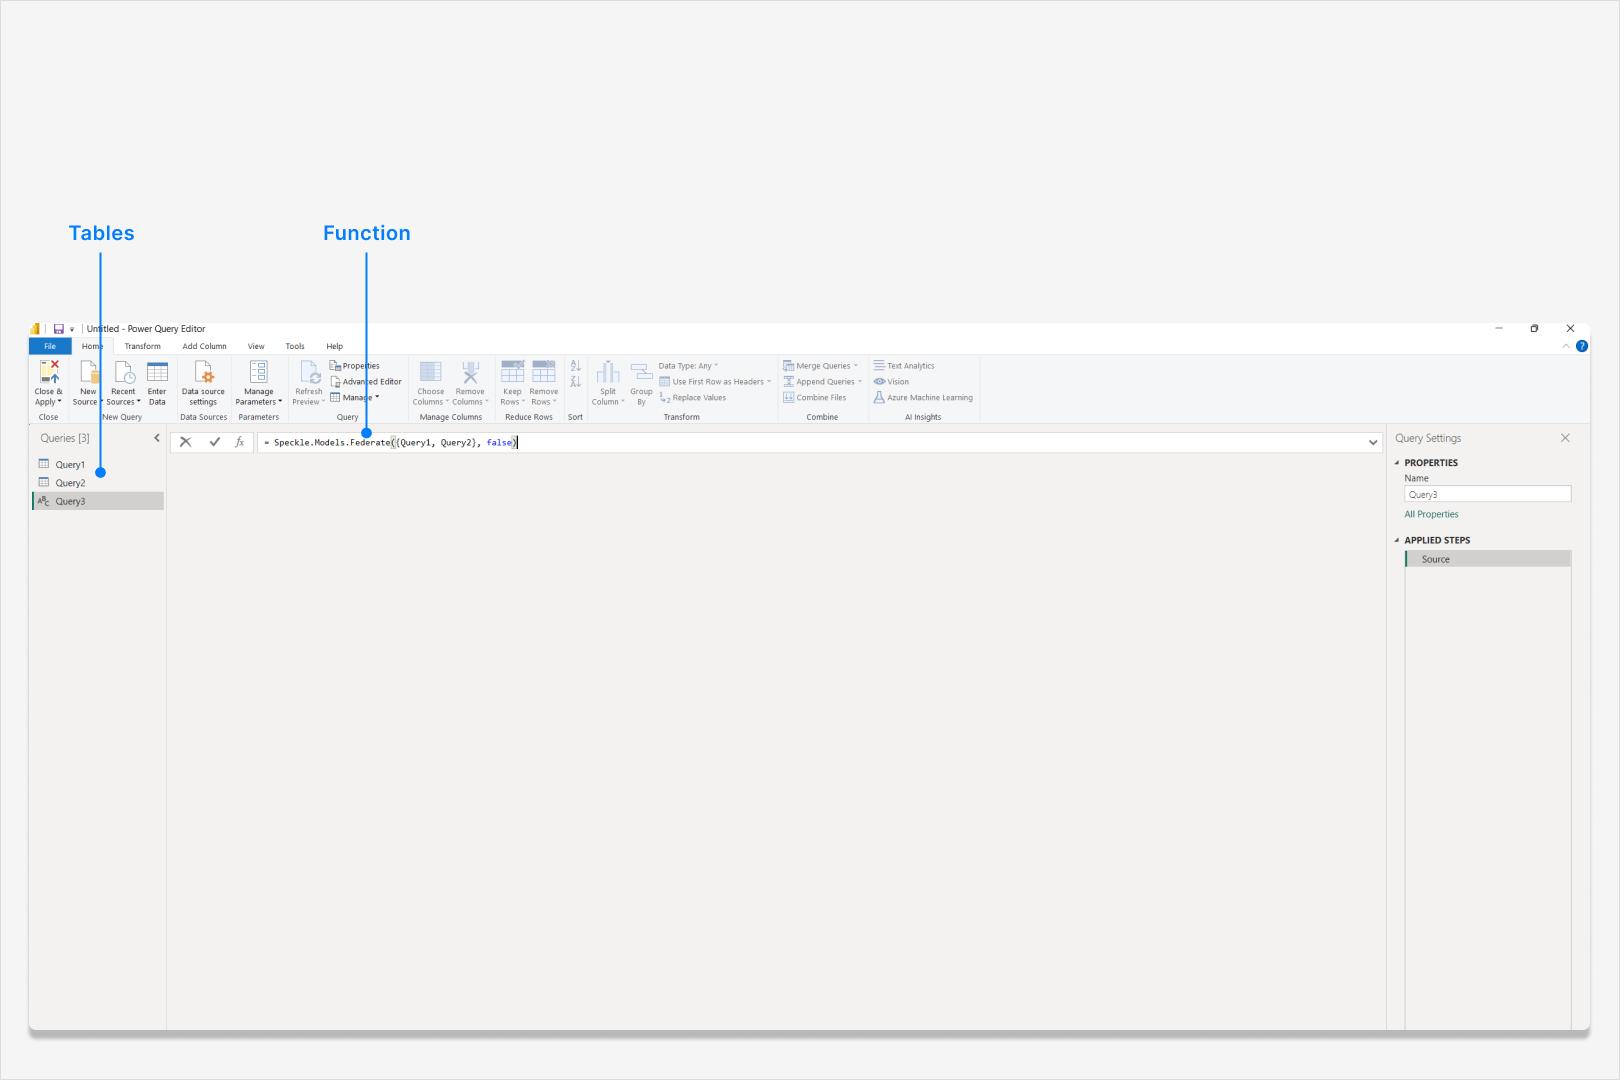
Speckle.Models.Federate
Previously, you could federate models by supplying a federated model URL. Now, you can manually federate already-loaded models in Power BI using this function.
Tip: This function allows you to federate models from different Speckle projects.
Accepts a list of tables (each representing a model) and returns a federated table.
- Use
excludeData = trueto federate only the metadata necessary for 3D visuals (e.g., Version Object ID, Object IDs) without pulling in all the data.
Show Example
Show Example
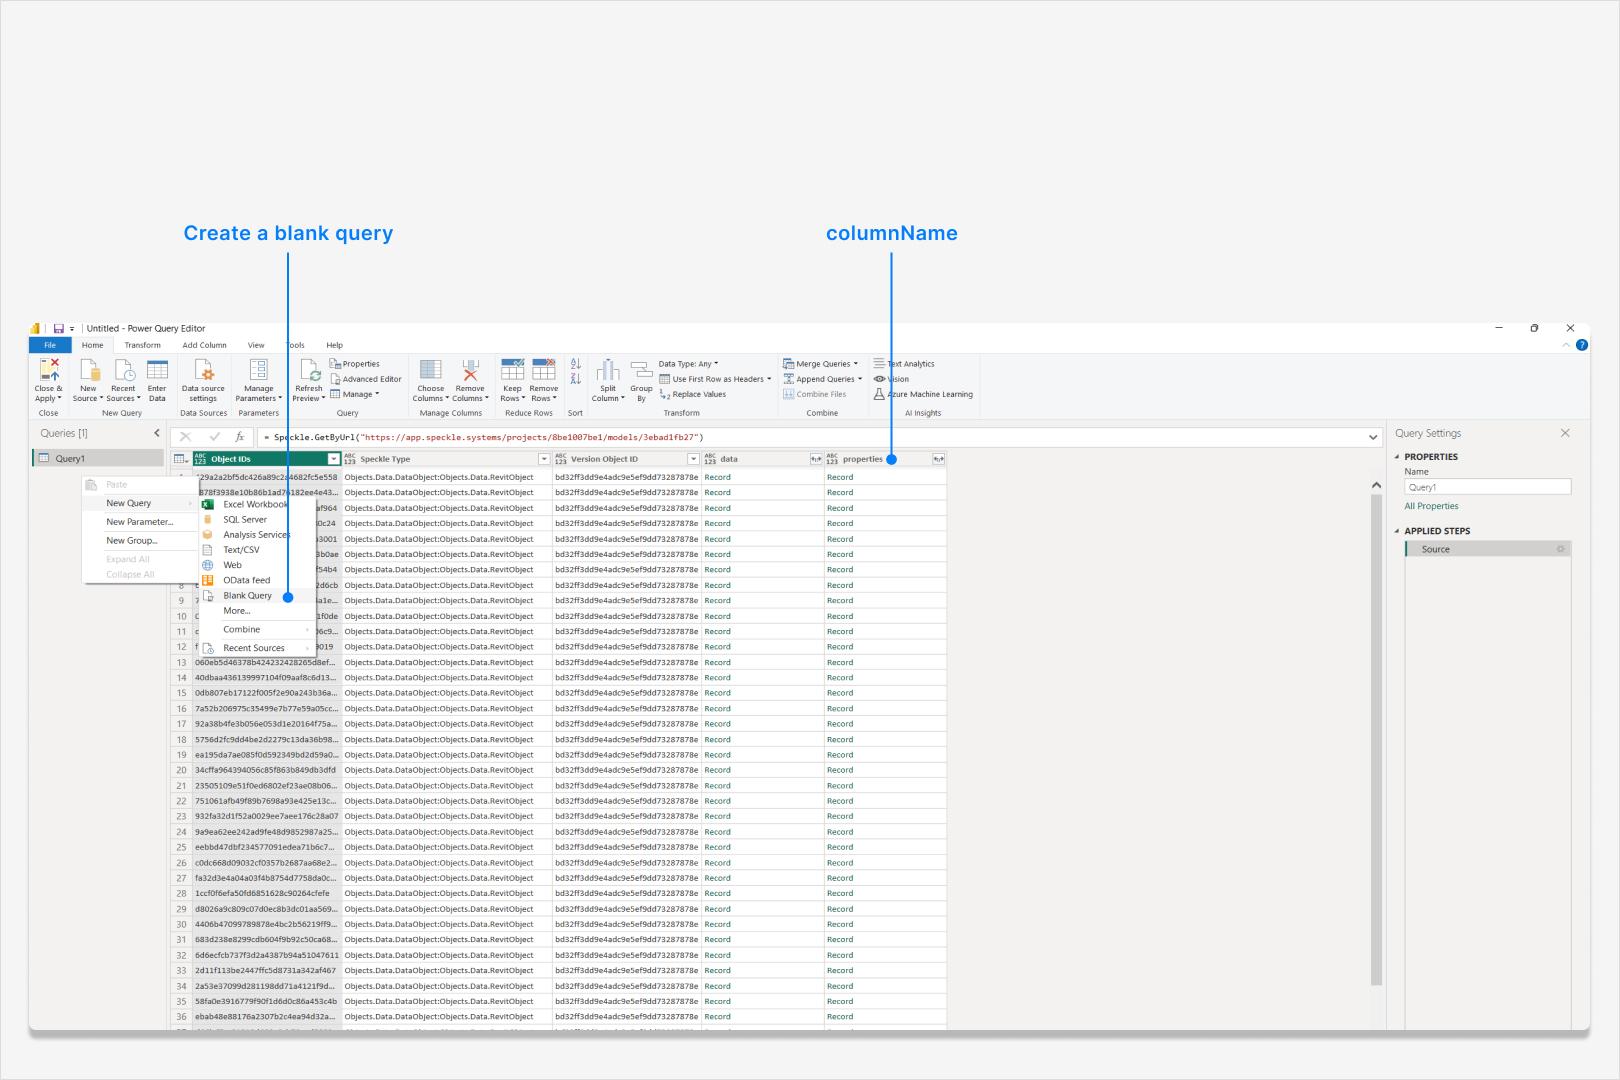
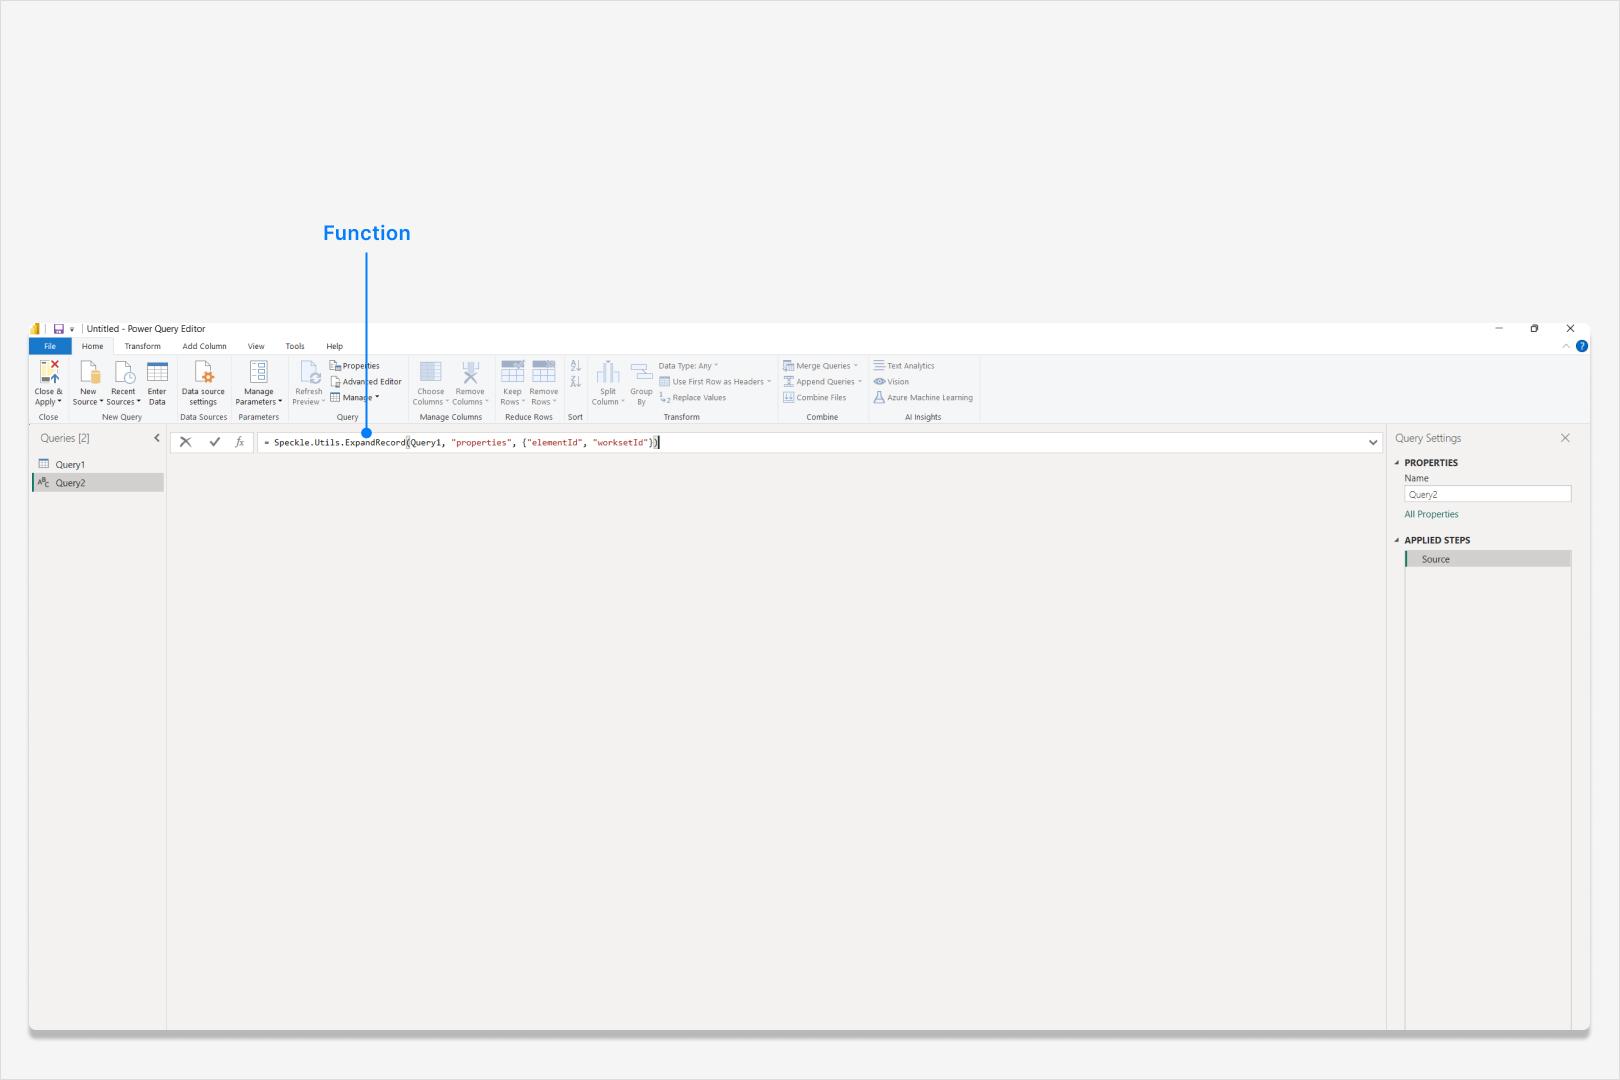
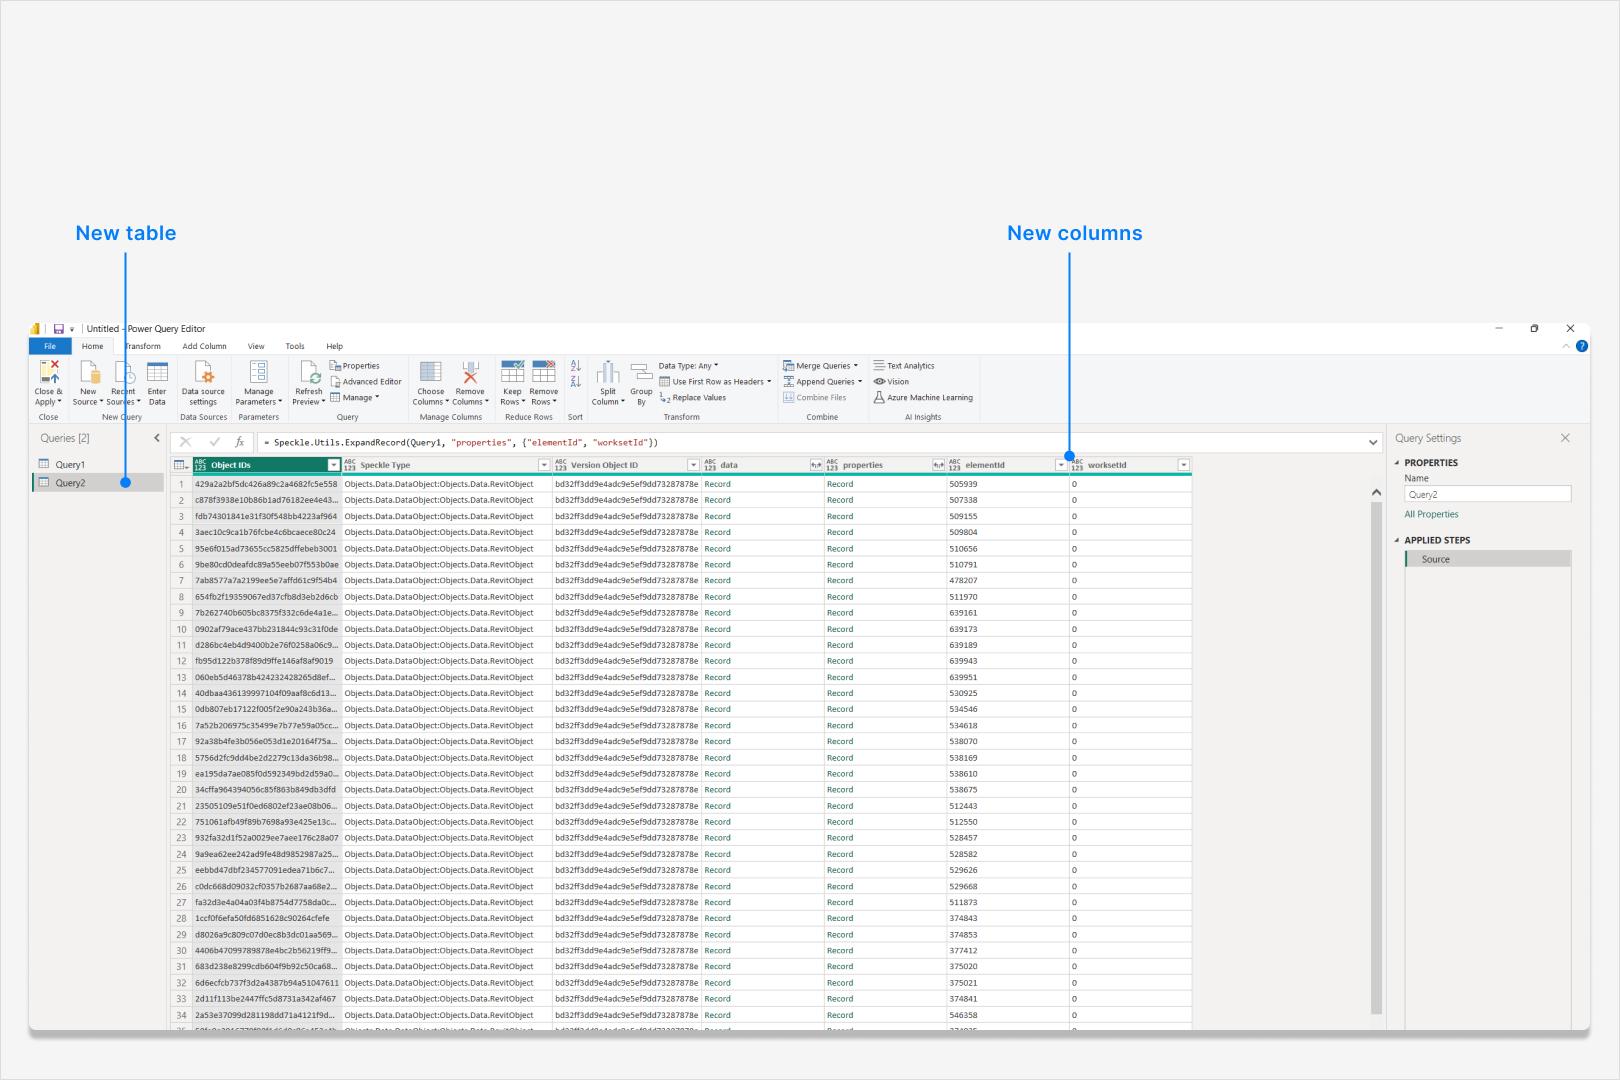
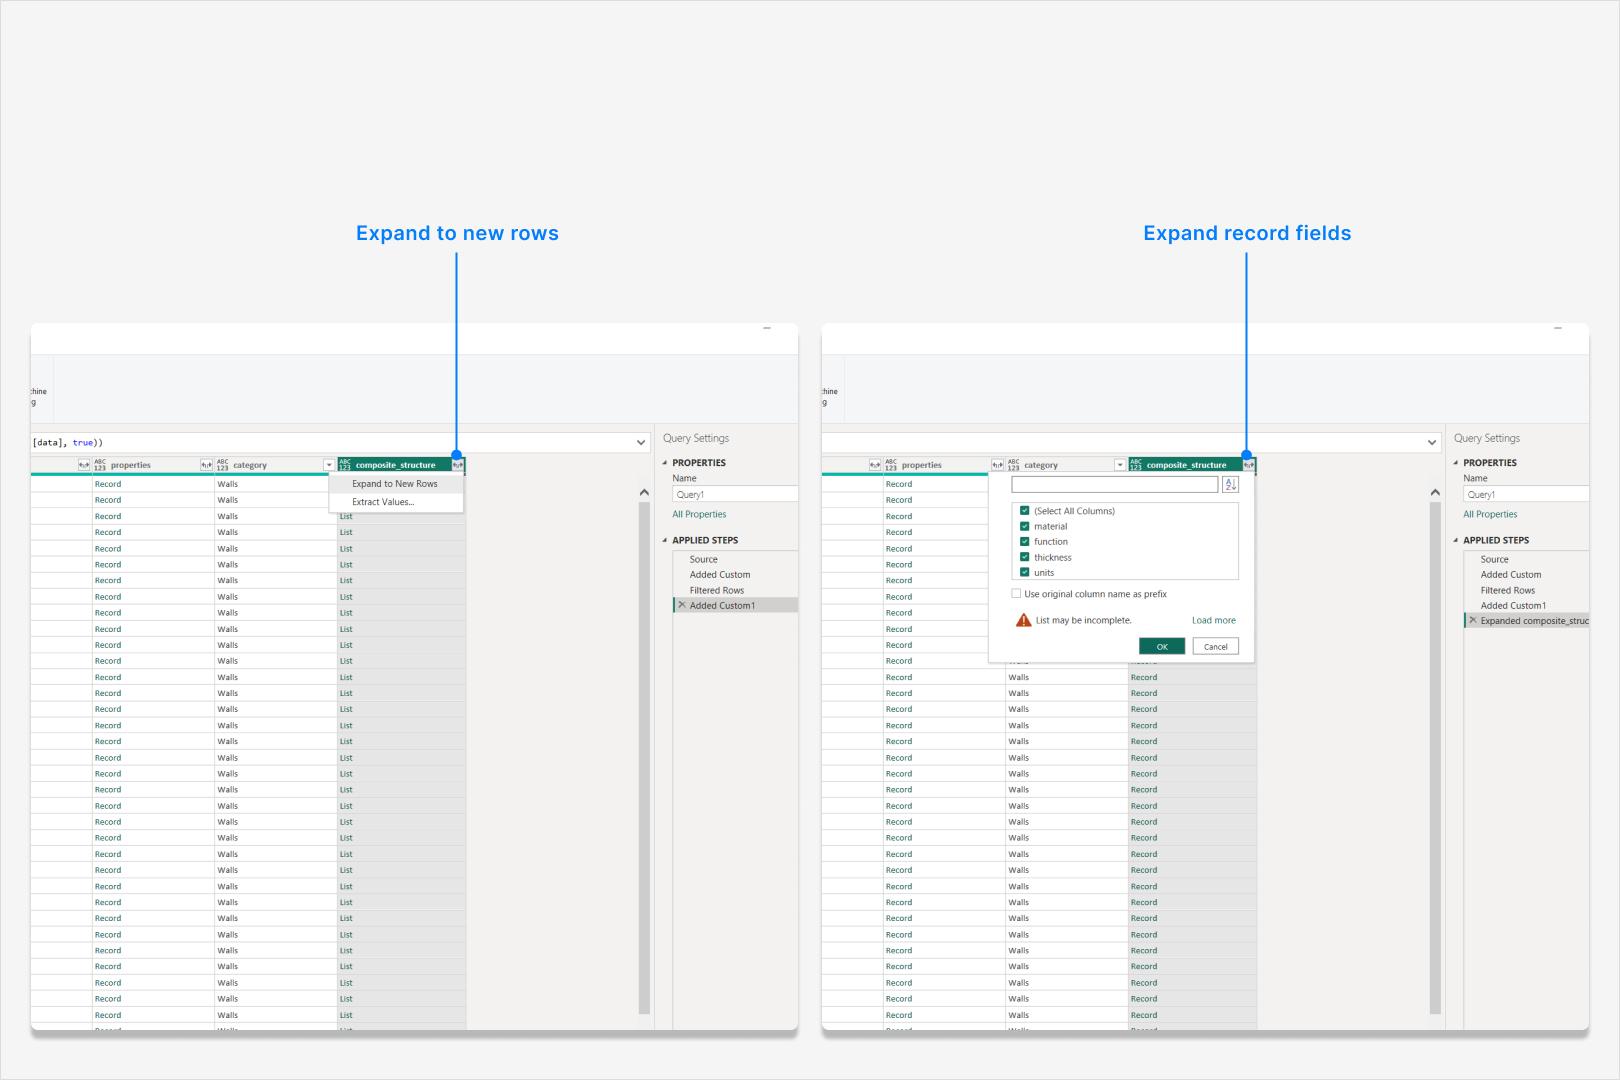
Speckle.Utils.ExpandRecord
This function expands a record column into separate columns for each field. It’s especially useful in combination with the Properties helper.
Expands the fields of a record column (
columnName) into individual columns in the table.
- Use
FieldNamesto limit the expanded fields. - Use
UseCombinedNames = trueto prefix column names with the record column name (e.g.,Properties.Length).
Show Example
Show Example