> ## Documentation Index
> Fetch the complete documentation index at: https://speckle-assistant.mintlify.site/llms.txt
> Use this file to discover all available pages before exploring further.
# Viewing Results
> Learn how to view and analyze Model Checker validation results.
## In the 3D Viewer
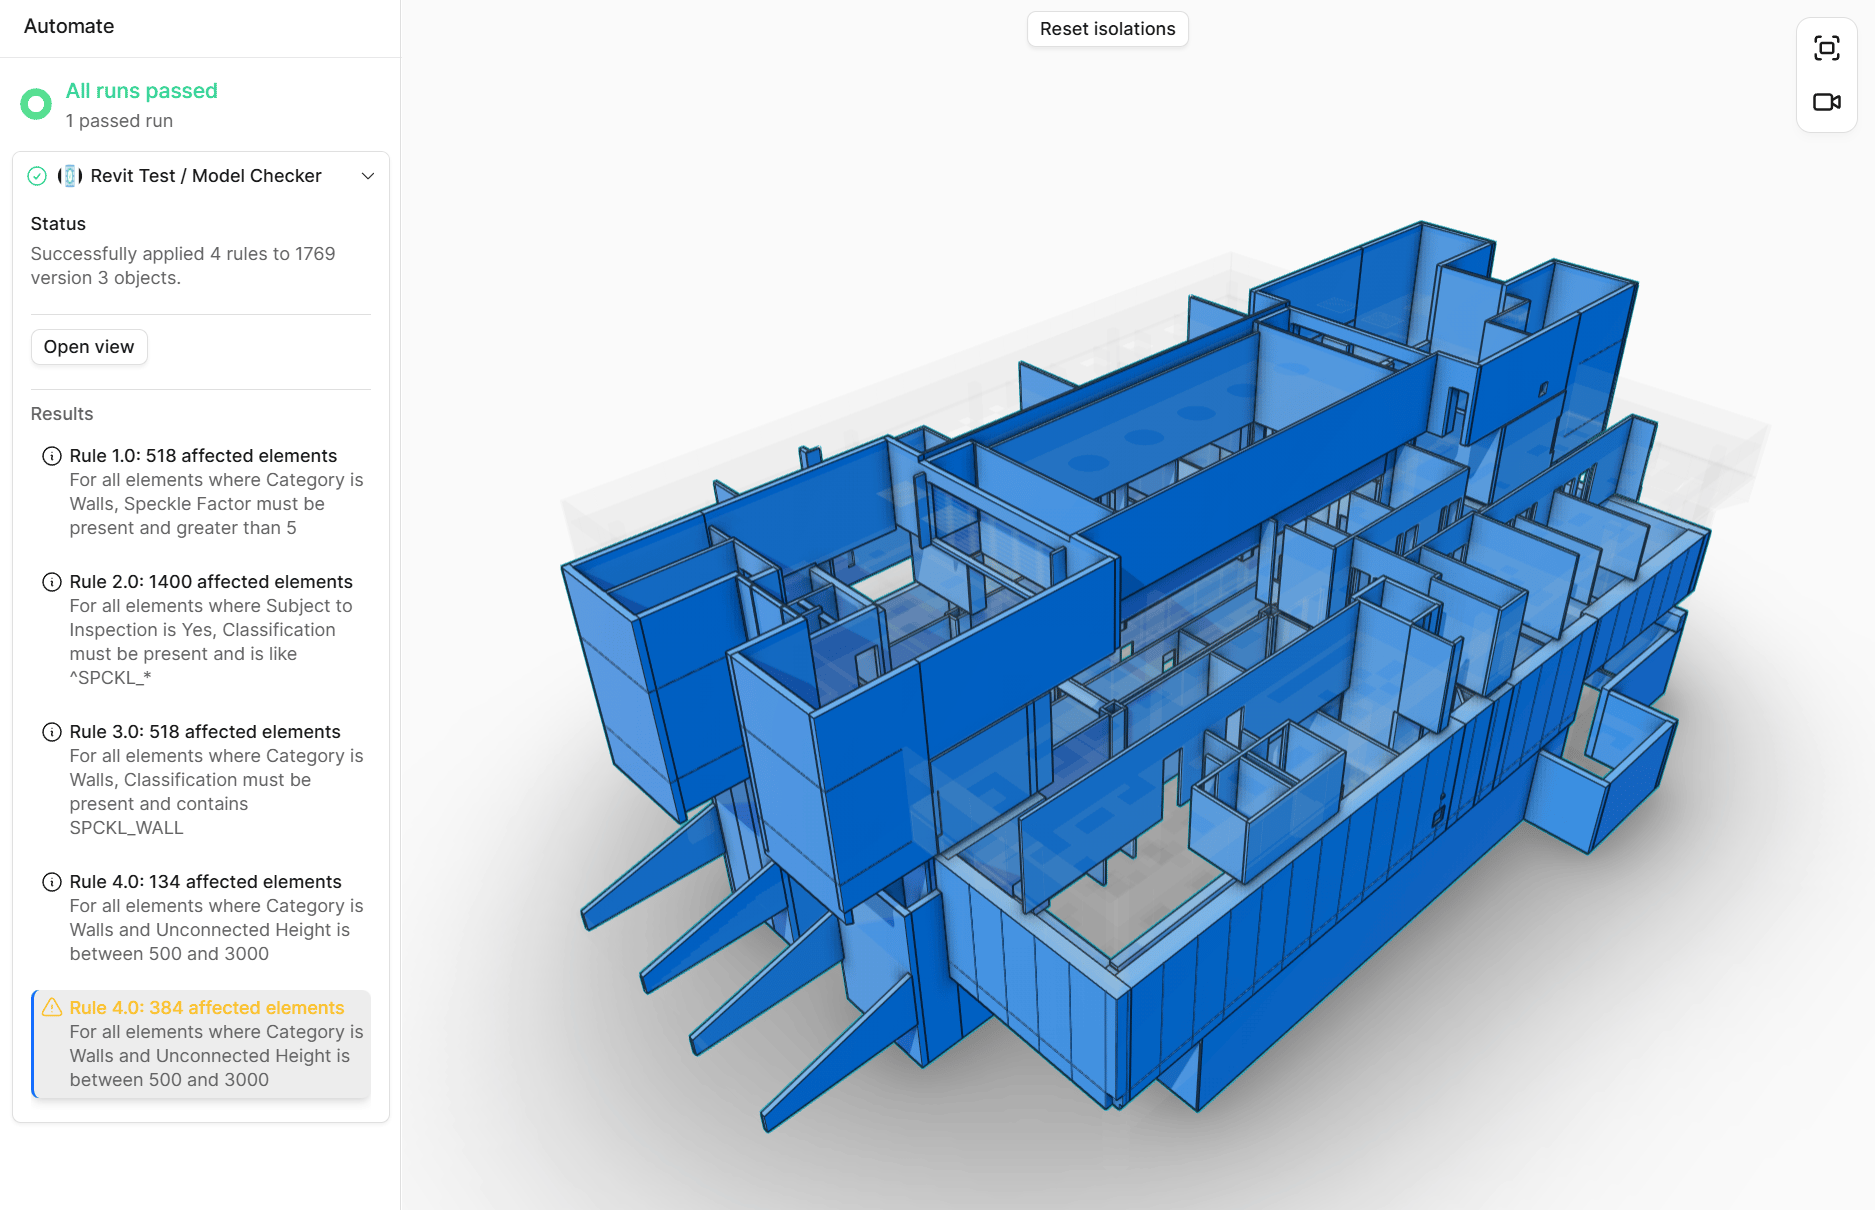
Model Checker results are integrated into Speckle's 3D viewer. Elements that fail validation rules are flagged with warnings or errors, making it easy to identify issues visually.
 ### Visual Indicators
* **Errors** - Critical issues that must be fixed
* **Warnings** - Moderate concerns that should be reviewed
* **Info** - Informational notifications
### Filtering by Results
You can filter the 3D viewer to show only elements that:
* Passed all rules
* Failed specific rules
* Have errors or warnings
* Match specific severity levels
## In Speckle Connectors
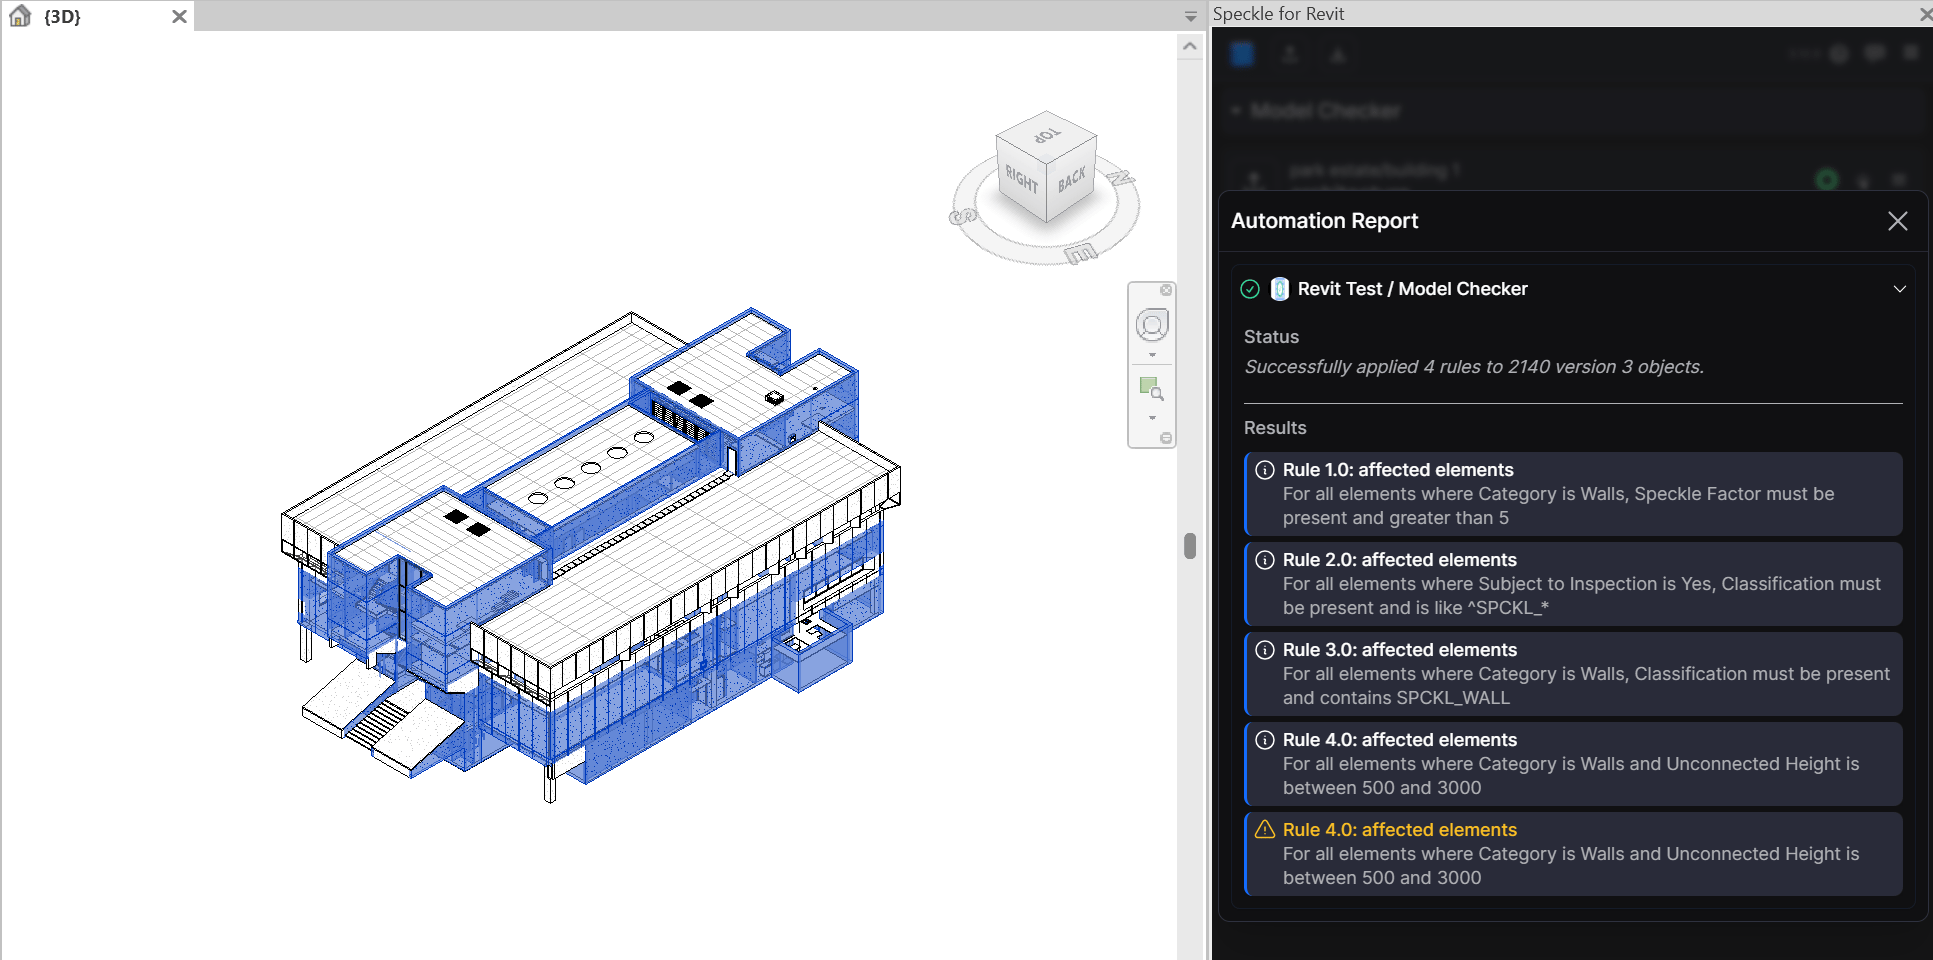
Model Checker reports are also viewable in Speckle connectors interface. You can view validation results directly in your host application (Revit, Rhino, etc.) and interact with failed elements.
### Isolating and Highlighting Elements
When viewing Model Checker results in a connector:
* **Isolate elements** that failed validation rules
* **Highlight elements** in your host application based on validation results
* **Navigate to specific elements** that need attention
* **Review validation messages** directly in the connector interface
This allows you to fix validation issues directly in your modeling software without switching between applications.
### Visual Indicators
* **Errors** - Critical issues that must be fixed
* **Warnings** - Moderate concerns that should be reviewed
* **Info** - Informational notifications
### Filtering by Results
You can filter the 3D viewer to show only elements that:
* Passed all rules
* Failed specific rules
* Have errors or warnings
* Match specific severity levels
## In Speckle Connectors
Model Checker reports are also viewable in Speckle connectors interface. You can view validation results directly in your host application (Revit, Rhino, etc.) and interact with failed elements.
### Isolating and Highlighting Elements
When viewing Model Checker results in a connector:
* **Isolate elements** that failed validation rules
* **Highlight elements** in your host application based on validation results
* **Navigate to specific elements** that need attention
* **Review validation messages** directly in the connector interface
This allows you to fix validation issues directly in your modeling software without switching between applications.
 ## In Intelligence Dashboards
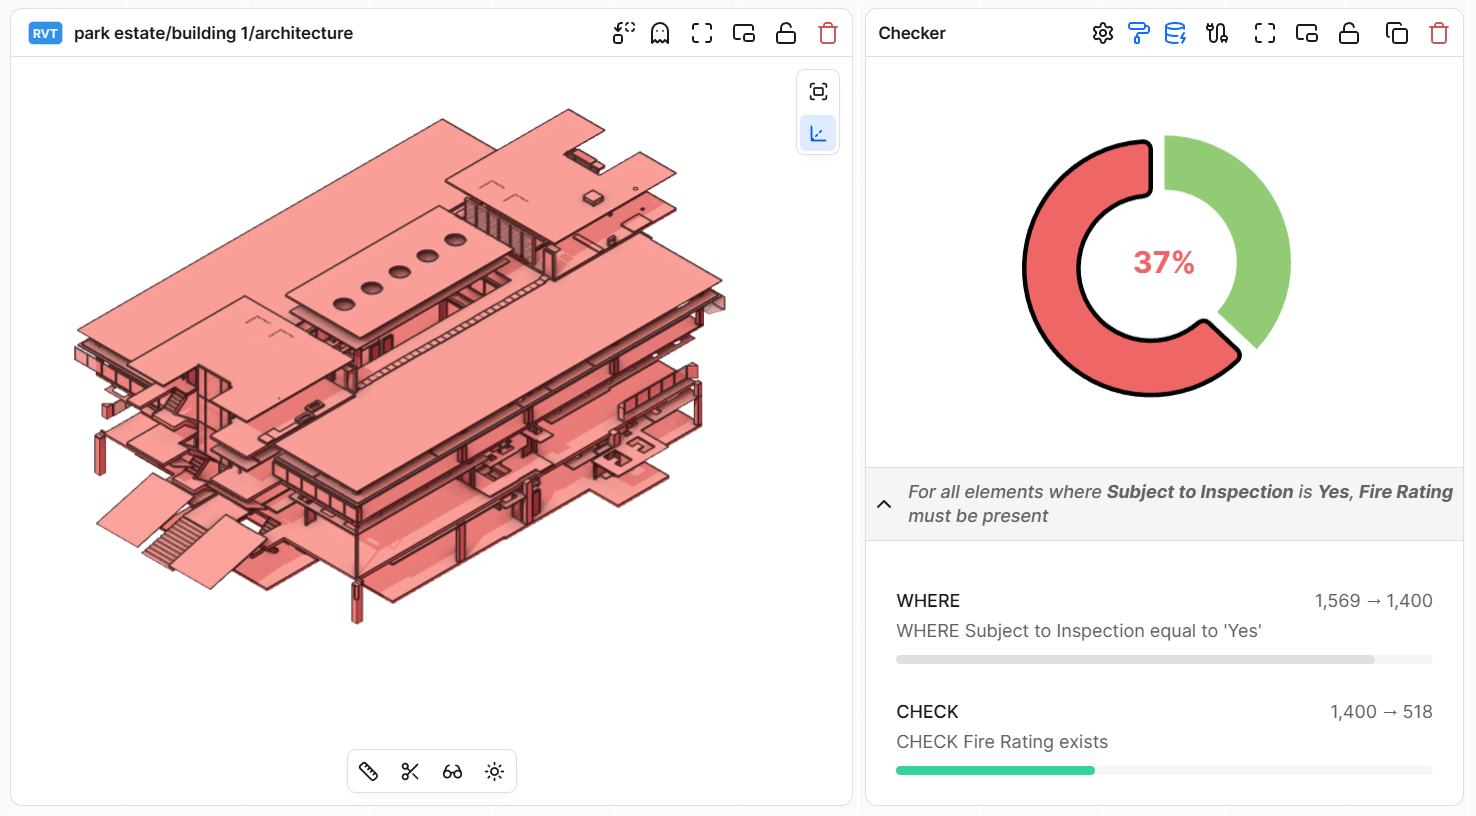
The **Property Checker** in Intelligence dashboards provides a quick way to see the outcomes of individual validation rules directly in your dashboard.
### What You Can Do
* **Create validation rules** directly in the dashboard widget
* **View pass/fail results** in a donut chart with percentages
* **See validation steps** showing how many elements pass each WHERE, AND, and CHECK condition
* **Colorize the 3D viewer** based on pass/fail results
* **Get real-time validation** against dashboard data sources
* **View breakdown by property** to analyze validation results across different property values
### Individual Rule Outcomes
Property Checker shows the outcome of each rule you configure:
* **Pass rate percentage** displayed in the center of the donut chart
* **Passed vs. Failed counts** for elements that reached the CHECK step
* **Validation chain steps** showing how many elements pass each filter condition
* **Human-readable rule description** explaining what the rule checks
This is particularly useful for **quick validation checks** within a dashboard or when you need immediate visual feedback on model data quality.
## In Intelligence Dashboards
The **Property Checker** in Intelligence dashboards provides a quick way to see the outcomes of individual validation rules directly in your dashboard.
### What You Can Do
* **Create validation rules** directly in the dashboard widget
* **View pass/fail results** in a donut chart with percentages
* **See validation steps** showing how many elements pass each WHERE, AND, and CHECK condition
* **Colorize the 3D viewer** based on pass/fail results
* **Get real-time validation** against dashboard data sources
* **View breakdown by property** to analyze validation results across different property values
### Individual Rule Outcomes
Property Checker shows the outcome of each rule you configure:
* **Pass rate percentage** displayed in the center of the donut chart
* **Passed vs. Failed counts** for elements that reached the CHECK step
* **Validation chain steps** showing how many elements pass each filter condition
* **Human-readable rule description** explaining what the rule checks
This is particularly useful for **quick validation checks** within a dashboard or when you need immediate visual feedback on model data quality.
 ### Breakdown Tab
The **Breakdown** tab allows you to analyze validation results by grouping them according to properties from your model objects. This helps you identify patterns in validation failures across different categories, types, or other property values.
**To use the Breakdown tab:**
1. Ensure validation has run and results are available (check the Summary tab)
2. Navigate to the **Breakdown** tab
3. Select a property from the dropdown to view validation results grouped by that property's values
4. The chart will update to show pass/fail rates for each property value
**Property Selection Requirements:**
The property dropdown in the Breakdown tab will only be usable when:
* Validation rules are configured and have been executed
* Validation results are available (check the Summary tab to confirm)
* Model objects with validation results are accessible
* Properties exist on the model objects that have validation results
If the property dropdown is disabled even though validation has run:
* Verify that the model source is properly connected and loaded
* Check that validation results include object references
* Ensure the model objects have properties that can be used for breakdown
* Try refreshing the validation results or re-running the validation
Property Checker validates against the data sources in your dashboard, making it perfect for ad-hoc validation checks. For reusable rulesets and automation integration, use the full [Model Checker UI](/analytics/model-checker/overview).
## Understanding Results
### Rule Status
Each rule in your ruleset will show:
* **Pass** - All elements passed the validation
* **Fail** - Some elements failed the validation
* **Not Applied** - Rule couldn't be evaluated (e.g., no matching elements)
### Element Status
Each model element will show:
* Which rules it passed or failed
* The severity of any failures
* The message associated with each failure
## In Power BI
Model Checker results can be visualized and analyzed in Power BI, allowing you to create custom dashboards and track model data quality over time.
### What You Can Do
* **Query validation results** for one or multiple model versions using Speckle's GraphQL API
* **Establish relationships** between validation results and 3D model objects
* **Track model health over time** using interactive Power BI charts
* **Create custom reports** tailored to your project needs
### Getting Started
To view Model Checker results in Power BI:
1. Use Power BI Desktop with the **Speckle Data Connector** or query Speckle's GraphQL API directly
2. Query the `automationsStatus` field from model versions to access validation results
3. Extract validation data including:
* **Category** (validation rule applied)
* **Level** (error, warning, info)
* **Object IDs** (affected elements)
* **Message** (rule description)
* **Metadata** (custom rule details)
4. Link validation results to model objects using Object IDs
5. Create visualizations to track trends and analyze model quality
This approach is particularly useful for **Project Managers, BIM Coordinators, and Engineers** who need deeper insights into model validation beyond what's available in the 3D viewer.
### Power Query M Code Examples
Extract project and model IDs from your Speckle URL:
```m theme={null}
let
projectUrl = "https://your-speckle-server/projects/{your-project-id}/models/{your-model-id}",
parsedUrl = Speckle.Parser(projectUrl)
in
parsedUrl
```
Rename this query to **ParsedSpeckleURL**.
Query validation results for a single model version:
```m theme={null}
let
query = """
query GetCheckerResults($projectId: String!, $modelId: String!, $limit: Int!) {
project(id: $projectId) {
model(id: $modelId) {
versions(limit: $limit) {
items {
automationsStatus {
automationRuns {
functionRuns {
results
}
}
}
}
}
}
}
}
""",
variables = [
projectId = ParsedSpeckleURL[projectId],
modelId = ParsedSpeckleURL[modelId],
limit = 1
],
response = Speckle.Api.Fetch(ParsedSpeckleURL[baseUrl], query, variables)
in
response
```
Rename this query to **ModelCheckerResults**.
Get all automation runs from the response:
```m theme={null}
objects = response[project][model][versions][items]{0}[automationsStatus][automationsRuns]
```
Expand **objectResults** in Power Query to extract:
* **Category** (validation rule applied)
* **Level** (error, warning, info)
* **Object IDs** (affected elements)
* **Message** (rule description)
* **Metadata** (custom rule details)
To track model health over time, modify the query to fetch multiple versions:
```m theme={null}
let
variables = [
projectId = ParsedSpeckleURL[projectId],
modelId = ParsedSpeckleURL[modelId],
limit = 3
]
in
// Use the same query structure with increased limit
```
This allows you to create trend charts showing validation results across multiple model versions.
## Best Practices
### Regular Review
Set up regular reviews of Model Checker results to catch issues early in your workflow.
### Team Collaboration
Share results with your team to ensure everyone is aware of validation issues and can address them promptly.
Elements that fail validation are visually flagged in the 3D viewer. You can click on flagged elements to see which rules they failed and the associated messages.
Yes, you can filter the 3D viewer to show only elements that failed specific rules. This helps you focus on particular validation issues.
A rule shows as "Not Applied" when it couldn't be evaluated, typically because no elements matched the `WHERE` condition. This is normal and doesn't indicate an error.
Results are updated automatically when new model versions are published and the Model Checker automation runs.
Yes, you can query Model Checker results using Speckle's GraphQL API and visualize them in Power BI. This allows you to create custom dashboards, track model quality over time, and establish relationships between validation results and model objects. Access validation results through the `automationsStatus` field in model versions.
Yes, Property Checker in Intelligence dashboards lets you create validation rules directly in your dashboard and see the outcomes of individual rules. Property Checker displays pass/fail percentages, validation step counts, and can colorize the 3D viewer based on results. This is perfect for quick validation checks within a dashboard.
Yes, Model Checker reports are viewable in Speckle connectors interface. You can isolate and highlight elements that failed validation directly in your host application (Revit, Rhino, etc.), making it easy to fix issues without leaving your modeling software.
The property selection dropdown in the Breakdown tab requires that:
* Validation has been executed and results are available
* Model objects with validation results are accessible and have properties
* The model source is properly connected to the validation widget
If the dropdown remains disabled after validation has run, it may indicate that the model objects need to be loaded or that properties aren't available on the validated objects. Try refreshing the validation results or ensuring the model viewer widget is properly connected as the data source.
## Next Steps
* Learn about [creating rules and using rulesets](/analytics/model-checker/rules-and-rulesets)
### Breakdown Tab
The **Breakdown** tab allows you to analyze validation results by grouping them according to properties from your model objects. This helps you identify patterns in validation failures across different categories, types, or other property values.
**To use the Breakdown tab:**
1. Ensure validation has run and results are available (check the Summary tab)
2. Navigate to the **Breakdown** tab
3. Select a property from the dropdown to view validation results grouped by that property's values
4. The chart will update to show pass/fail rates for each property value
**Property Selection Requirements:**
The property dropdown in the Breakdown tab will only be usable when:
* Validation rules are configured and have been executed
* Validation results are available (check the Summary tab to confirm)
* Model objects with validation results are accessible
* Properties exist on the model objects that have validation results
If the property dropdown is disabled even though validation has run:
* Verify that the model source is properly connected and loaded
* Check that validation results include object references
* Ensure the model objects have properties that can be used for breakdown
* Try refreshing the validation results or re-running the validation
Property Checker validates against the data sources in your dashboard, making it perfect for ad-hoc validation checks. For reusable rulesets and automation integration, use the full [Model Checker UI](/analytics/model-checker/overview).
## Understanding Results
### Rule Status
Each rule in your ruleset will show:
* **Pass** - All elements passed the validation
* **Fail** - Some elements failed the validation
* **Not Applied** - Rule couldn't be evaluated (e.g., no matching elements)
### Element Status
Each model element will show:
* Which rules it passed or failed
* The severity of any failures
* The message associated with each failure
## In Power BI
Model Checker results can be visualized and analyzed in Power BI, allowing you to create custom dashboards and track model data quality over time.
### What You Can Do
* **Query validation results** for one or multiple model versions using Speckle's GraphQL API
* **Establish relationships** between validation results and 3D model objects
* **Track model health over time** using interactive Power BI charts
* **Create custom reports** tailored to your project needs
### Getting Started
To view Model Checker results in Power BI:
1. Use Power BI Desktop with the **Speckle Data Connector** or query Speckle's GraphQL API directly
2. Query the `automationsStatus` field from model versions to access validation results
3. Extract validation data including:
* **Category** (validation rule applied)
* **Level** (error, warning, info)
* **Object IDs** (affected elements)
* **Message** (rule description)
* **Metadata** (custom rule details)
4. Link validation results to model objects using Object IDs
5. Create visualizations to track trends and analyze model quality
This approach is particularly useful for **Project Managers, BIM Coordinators, and Engineers** who need deeper insights into model validation beyond what's available in the 3D viewer.
### Power Query M Code Examples
Extract project and model IDs from your Speckle URL:
```m theme={null}
let
projectUrl = "https://your-speckle-server/projects/{your-project-id}/models/{your-model-id}",
parsedUrl = Speckle.Parser(projectUrl)
in
parsedUrl
```
Rename this query to **ParsedSpeckleURL**.
Query validation results for a single model version:
```m theme={null}
let
query = """
query GetCheckerResults($projectId: String!, $modelId: String!, $limit: Int!) {
project(id: $projectId) {
model(id: $modelId) {
versions(limit: $limit) {
items {
automationsStatus {
automationRuns {
functionRuns {
results
}
}
}
}
}
}
}
}
""",
variables = [
projectId = ParsedSpeckleURL[projectId],
modelId = ParsedSpeckleURL[modelId],
limit = 1
],
response = Speckle.Api.Fetch(ParsedSpeckleURL[baseUrl], query, variables)
in
response
```
Rename this query to **ModelCheckerResults**.
Get all automation runs from the response:
```m theme={null}
objects = response[project][model][versions][items]{0}[automationsStatus][automationsRuns]
```
Expand **objectResults** in Power Query to extract:
* **Category** (validation rule applied)
* **Level** (error, warning, info)
* **Object IDs** (affected elements)
* **Message** (rule description)
* **Metadata** (custom rule details)
To track model health over time, modify the query to fetch multiple versions:
```m theme={null}
let
variables = [
projectId = ParsedSpeckleURL[projectId],
modelId = ParsedSpeckleURL[modelId],
limit = 3
]
in
// Use the same query structure with increased limit
```
This allows you to create trend charts showing validation results across multiple model versions.
## Best Practices
### Regular Review
Set up regular reviews of Model Checker results to catch issues early in your workflow.
### Team Collaboration
Share results with your team to ensure everyone is aware of validation issues and can address them promptly.
Elements that fail validation are visually flagged in the 3D viewer. You can click on flagged elements to see which rules they failed and the associated messages.
Yes, you can filter the 3D viewer to show only elements that failed specific rules. This helps you focus on particular validation issues.
A rule shows as "Not Applied" when it couldn't be evaluated, typically because no elements matched the `WHERE` condition. This is normal and doesn't indicate an error.
Results are updated automatically when new model versions are published and the Model Checker automation runs.
Yes, you can query Model Checker results using Speckle's GraphQL API and visualize them in Power BI. This allows you to create custom dashboards, track model quality over time, and establish relationships between validation results and model objects. Access validation results through the `automationsStatus` field in model versions.
Yes, Property Checker in Intelligence dashboards lets you create validation rules directly in your dashboard and see the outcomes of individual rules. Property Checker displays pass/fail percentages, validation step counts, and can colorize the 3D viewer based on results. This is perfect for quick validation checks within a dashboard.
Yes, Model Checker reports are viewable in Speckle connectors interface. You can isolate and highlight elements that failed validation directly in your host application (Revit, Rhino, etc.), making it easy to fix issues without leaving your modeling software.
The property selection dropdown in the Breakdown tab requires that:
* Validation has been executed and results are available
* Model objects with validation results are accessible and have properties
* The model source is properly connected to the validation widget
If the dropdown remains disabled after validation has run, it may indicate that the model objects need to be loaded or that properties aren't available on the validated objects. Try refreshing the validation results or ensuring the model viewer widget is properly connected as the data source.
## Next Steps
* Learn about [creating rules and using rulesets](/analytics/model-checker/rules-and-rulesets)